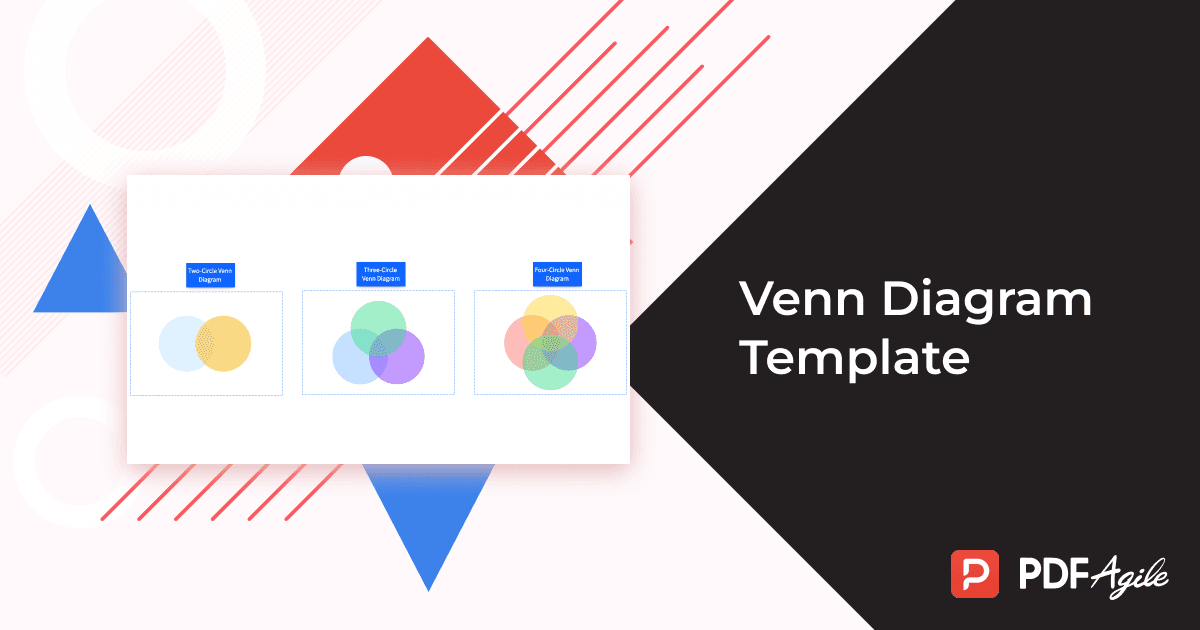
When it comes to organizing complex ideas, comparing different sets of information, or brainstorming for projects, a Venn Diagram is one of the most effective tools. Whether you're a student, educator, or business professional, using a Venn Diagram can make it easier to visualize relationships and simplify data comparison.
What is a Venn Diagram?
A Venn Diagram is a visual aid used to compare and contrast different sets of information. Typically composed of overlapping circles or shapes, these diagrams show how two or more sets of data intersect, revealing commonalities, differences, and unique characteristics.
Venn Diagrams are highly effective for:
- Educational purposes: Helping students compare and contrast different ideas, concepts, or historical events.
- Business applications: Analyzing market data, customer behavior, or product features.
- Personal use: Organizing thoughts, making decisions, or comparing options.
Why Use a Venn Diagram?
A Venn Diagram is an essential tool for many reasons:
- Clear Comparisons: It visually represents the overlap between different sets, making it easy to identify shared and unique traits at a glance.
- Boosts Critical Thinking: By using a Venn Diagram, you actively engage with the material, fostering better understanding and retention.
- Simplifies Complex Data: Whether you're comparing concepts, analyzing data, or brainstorming, a Venn Diagram helps break down complicated information into manageable parts.
- Great for Group Collaboration: It’s an excellent tool for group discussions and brainstorming sessions, allowing all members to contribute their insights.
Types of Venn Diagrams
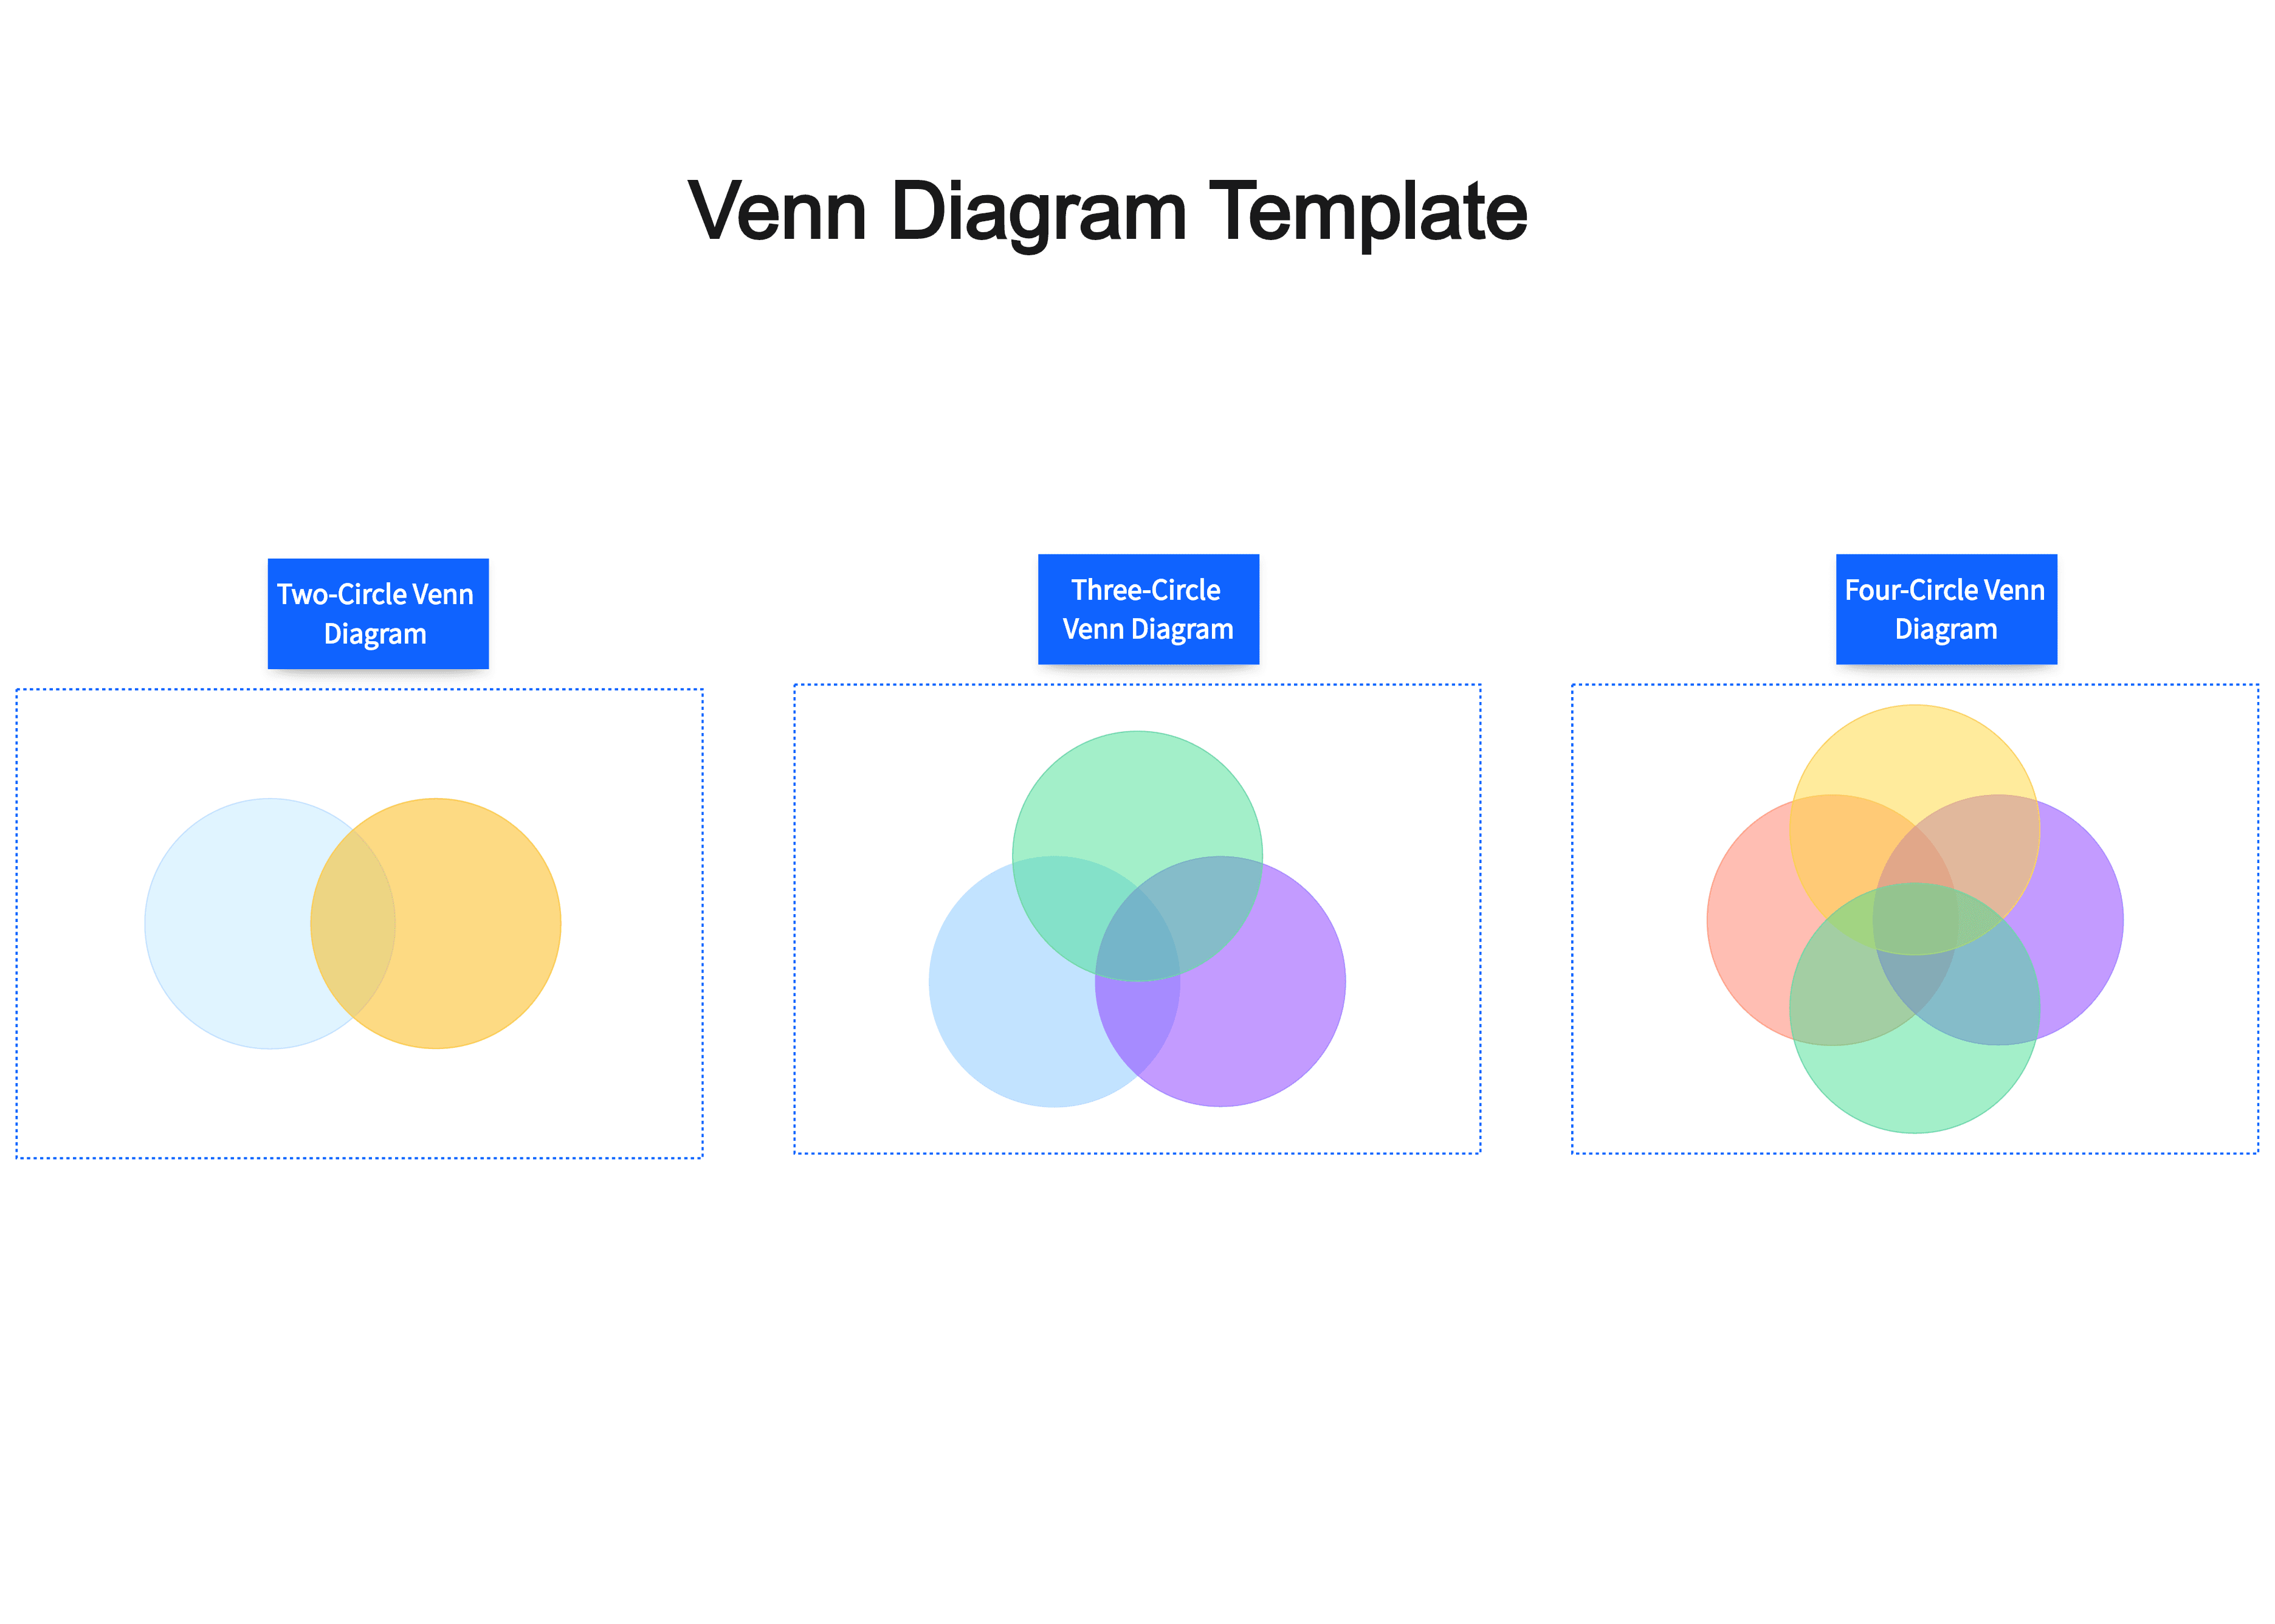
Venn Diagrams come in different styles, depending on how many sets you wish to compare. Here are the most common types of Venn Diagrams:
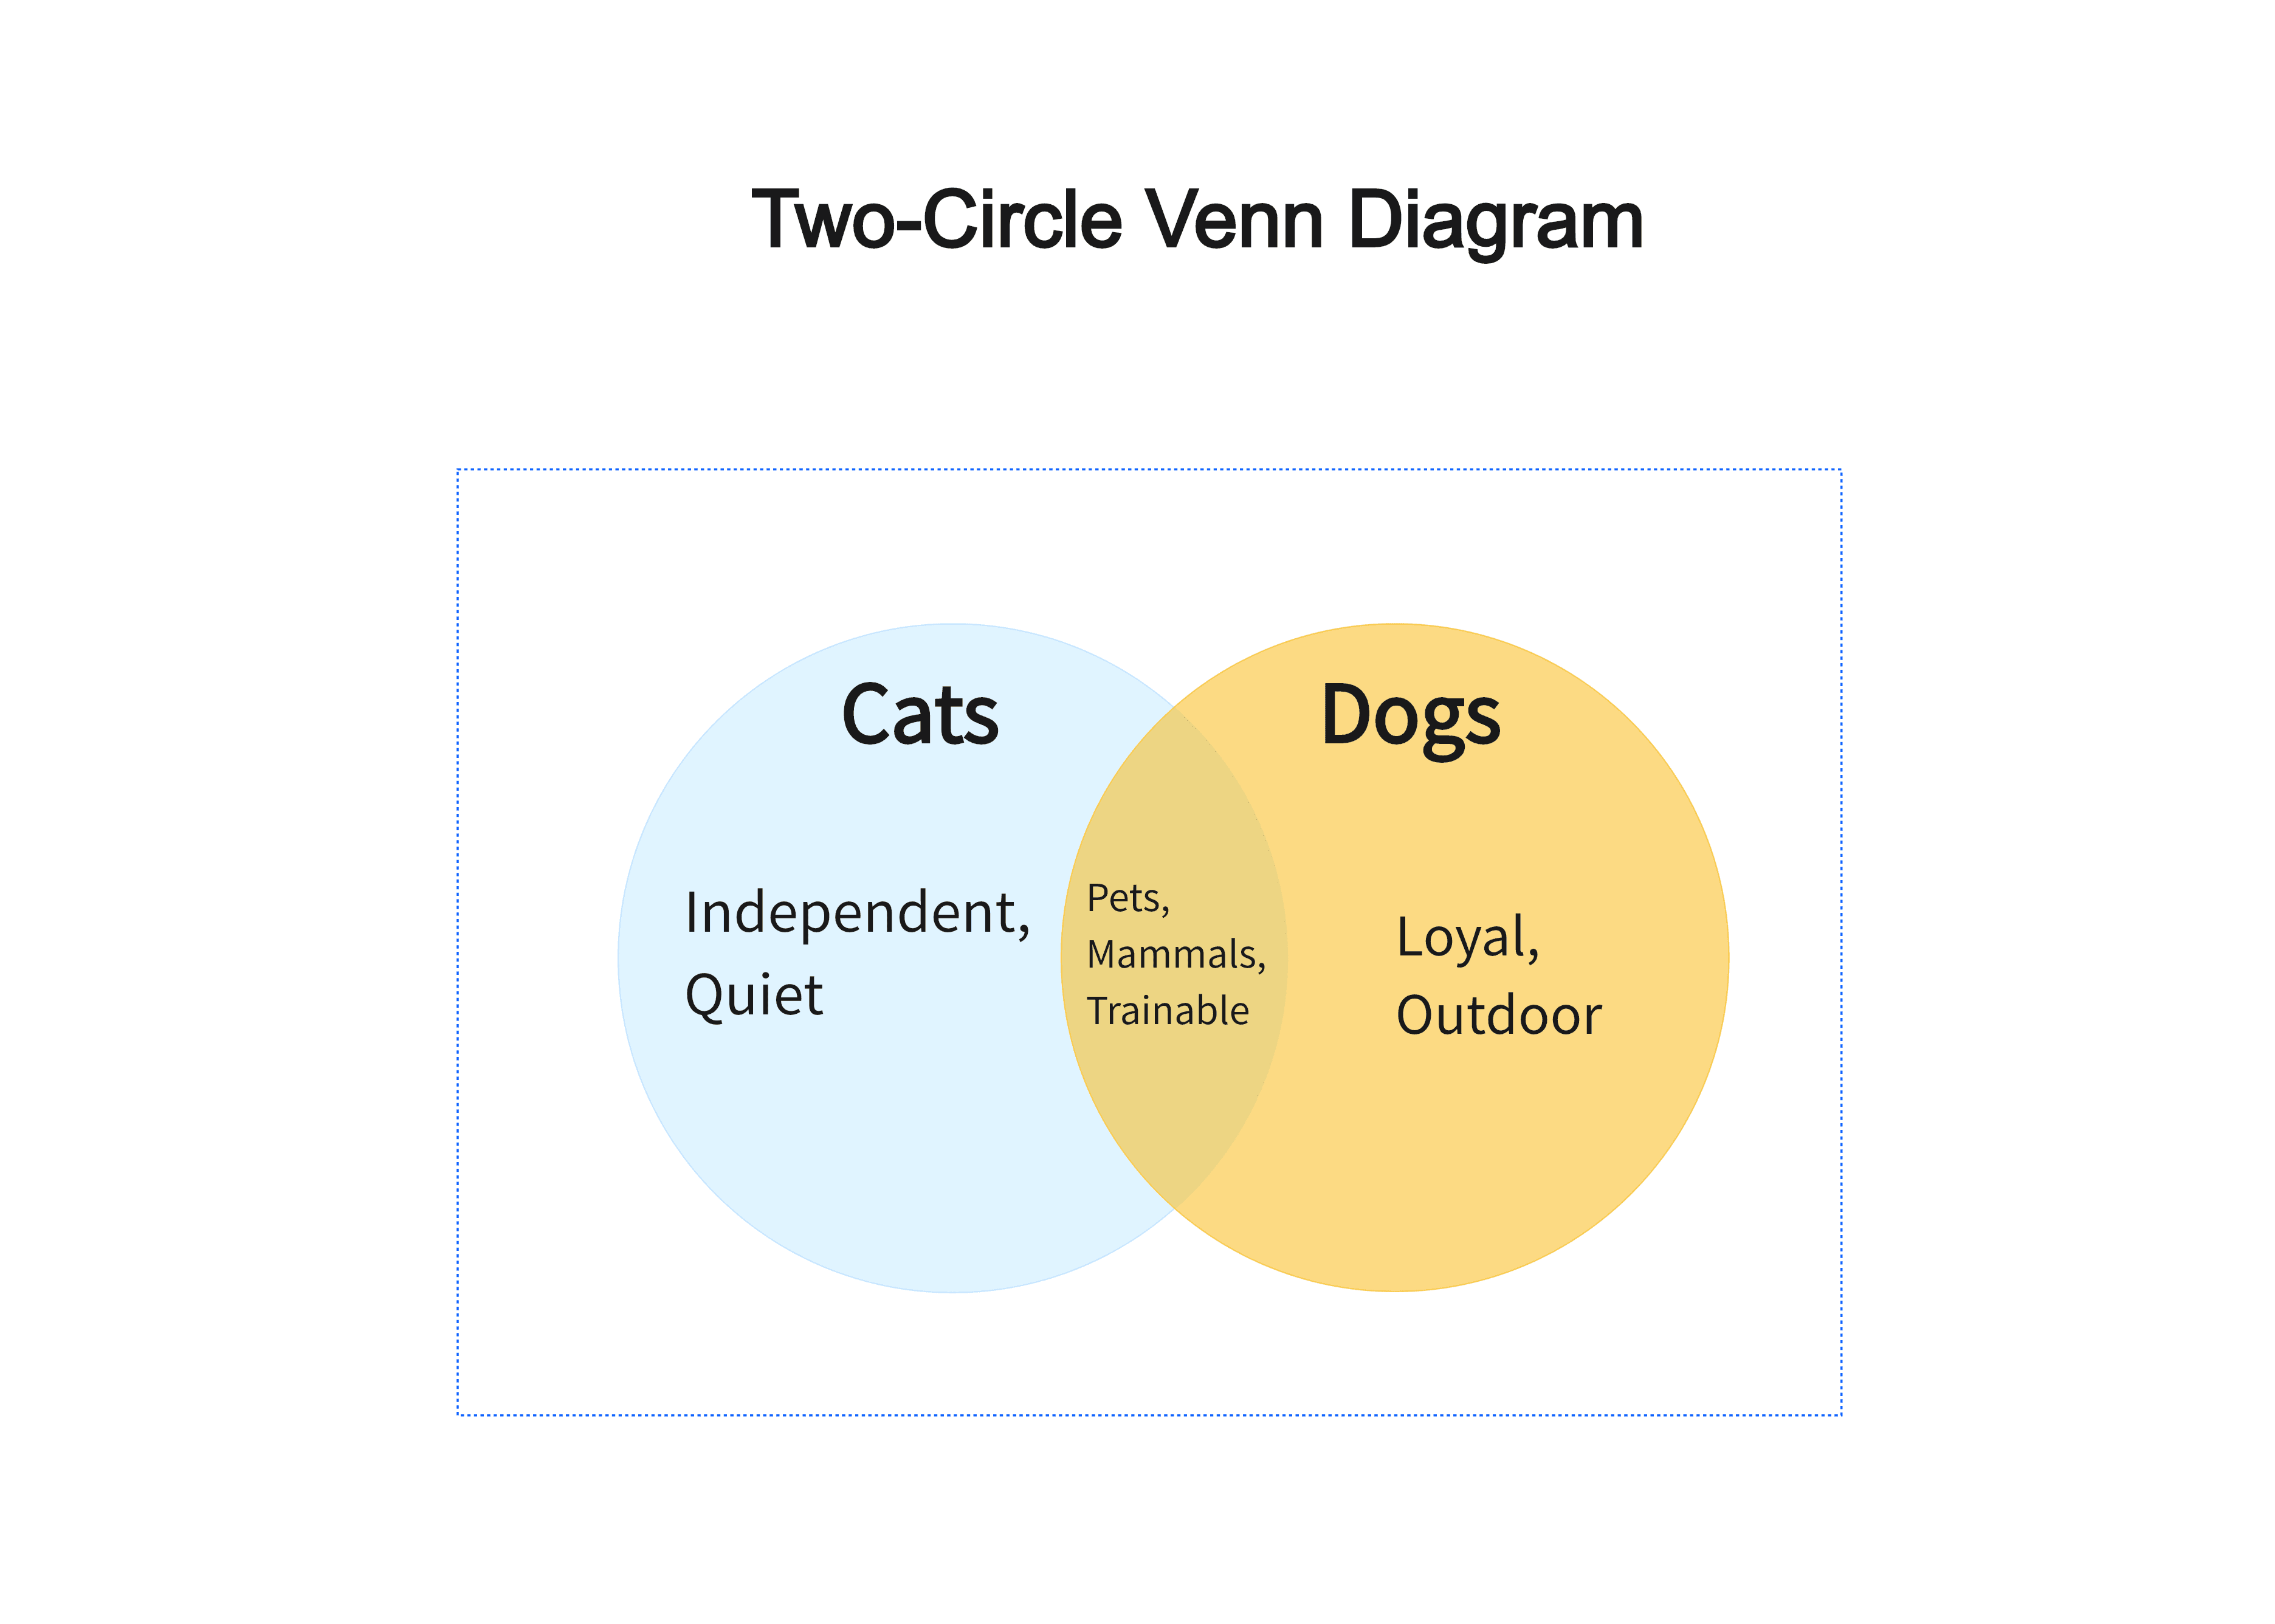
1. Two-Circle Venn Diagram
This is the simplest form of a Venn Diagram and is often used to compare two sets. The diagram highlights the similarities in the overlapping area and the unique aspects in the outer regions.
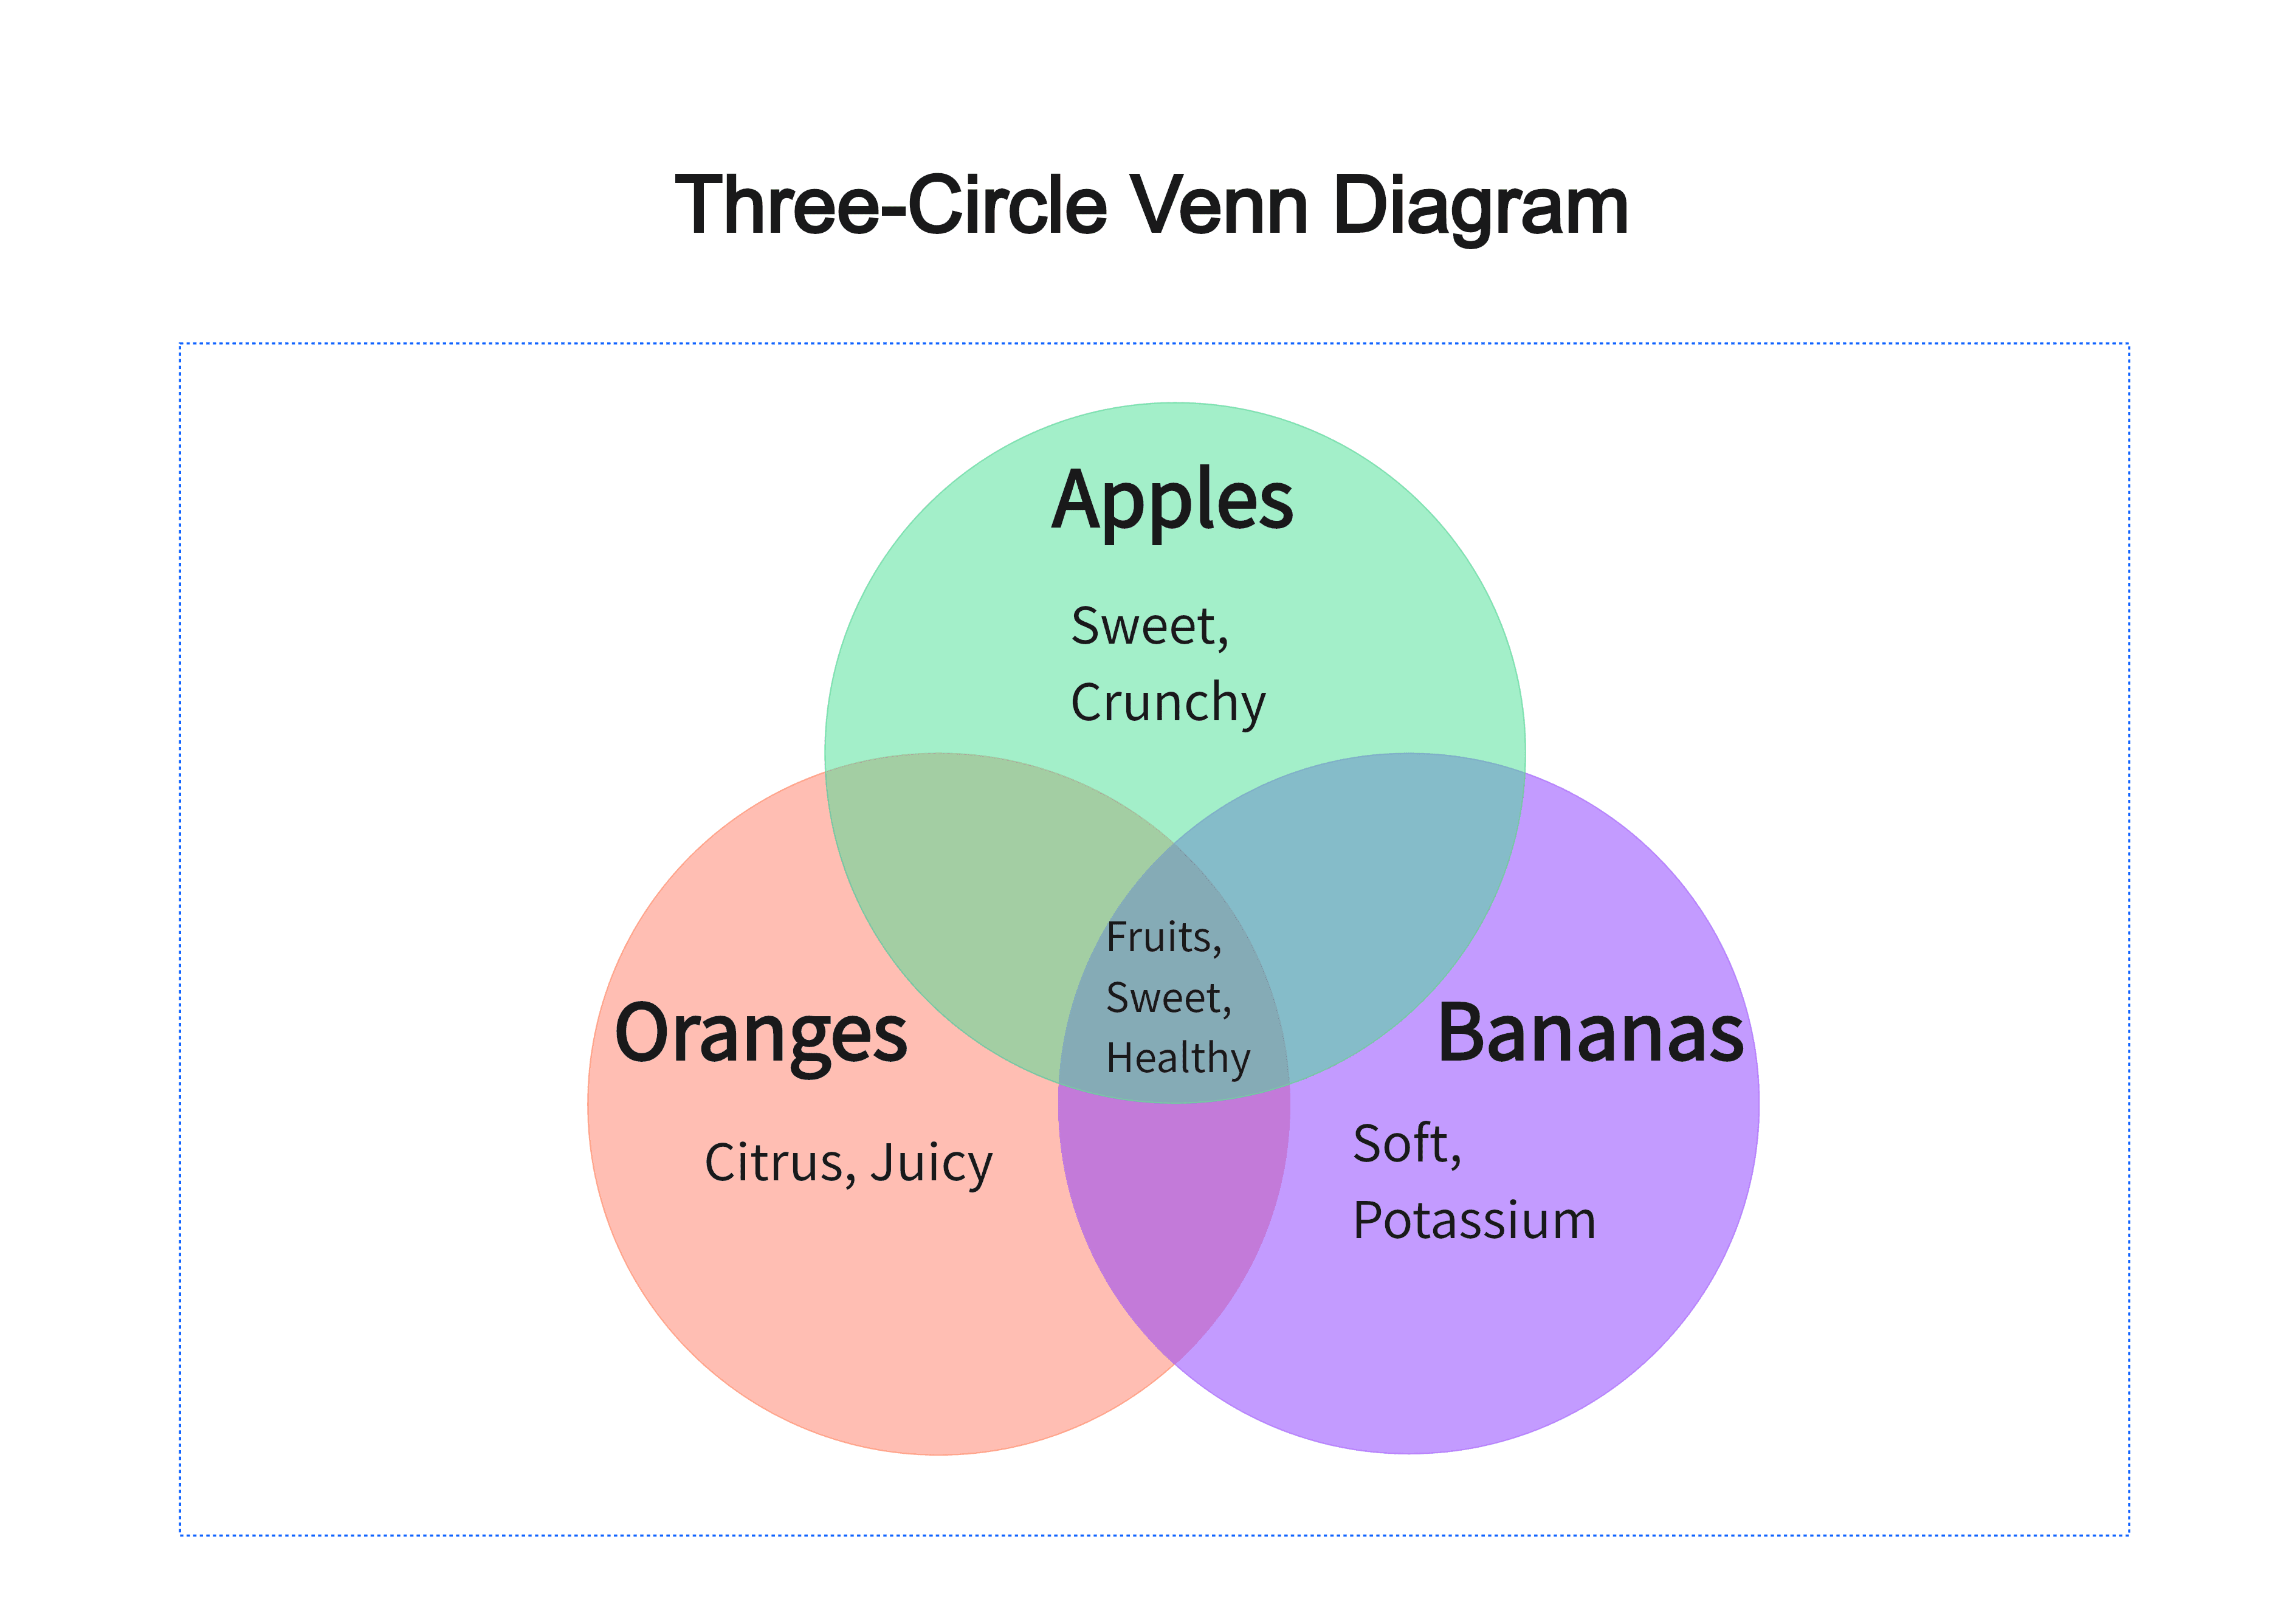
2. Three-Circle Venn Diagram
A more advanced version that allows for comparing three sets. The overlapping areas increase, giving more detailed insights into the relationships between the sets.
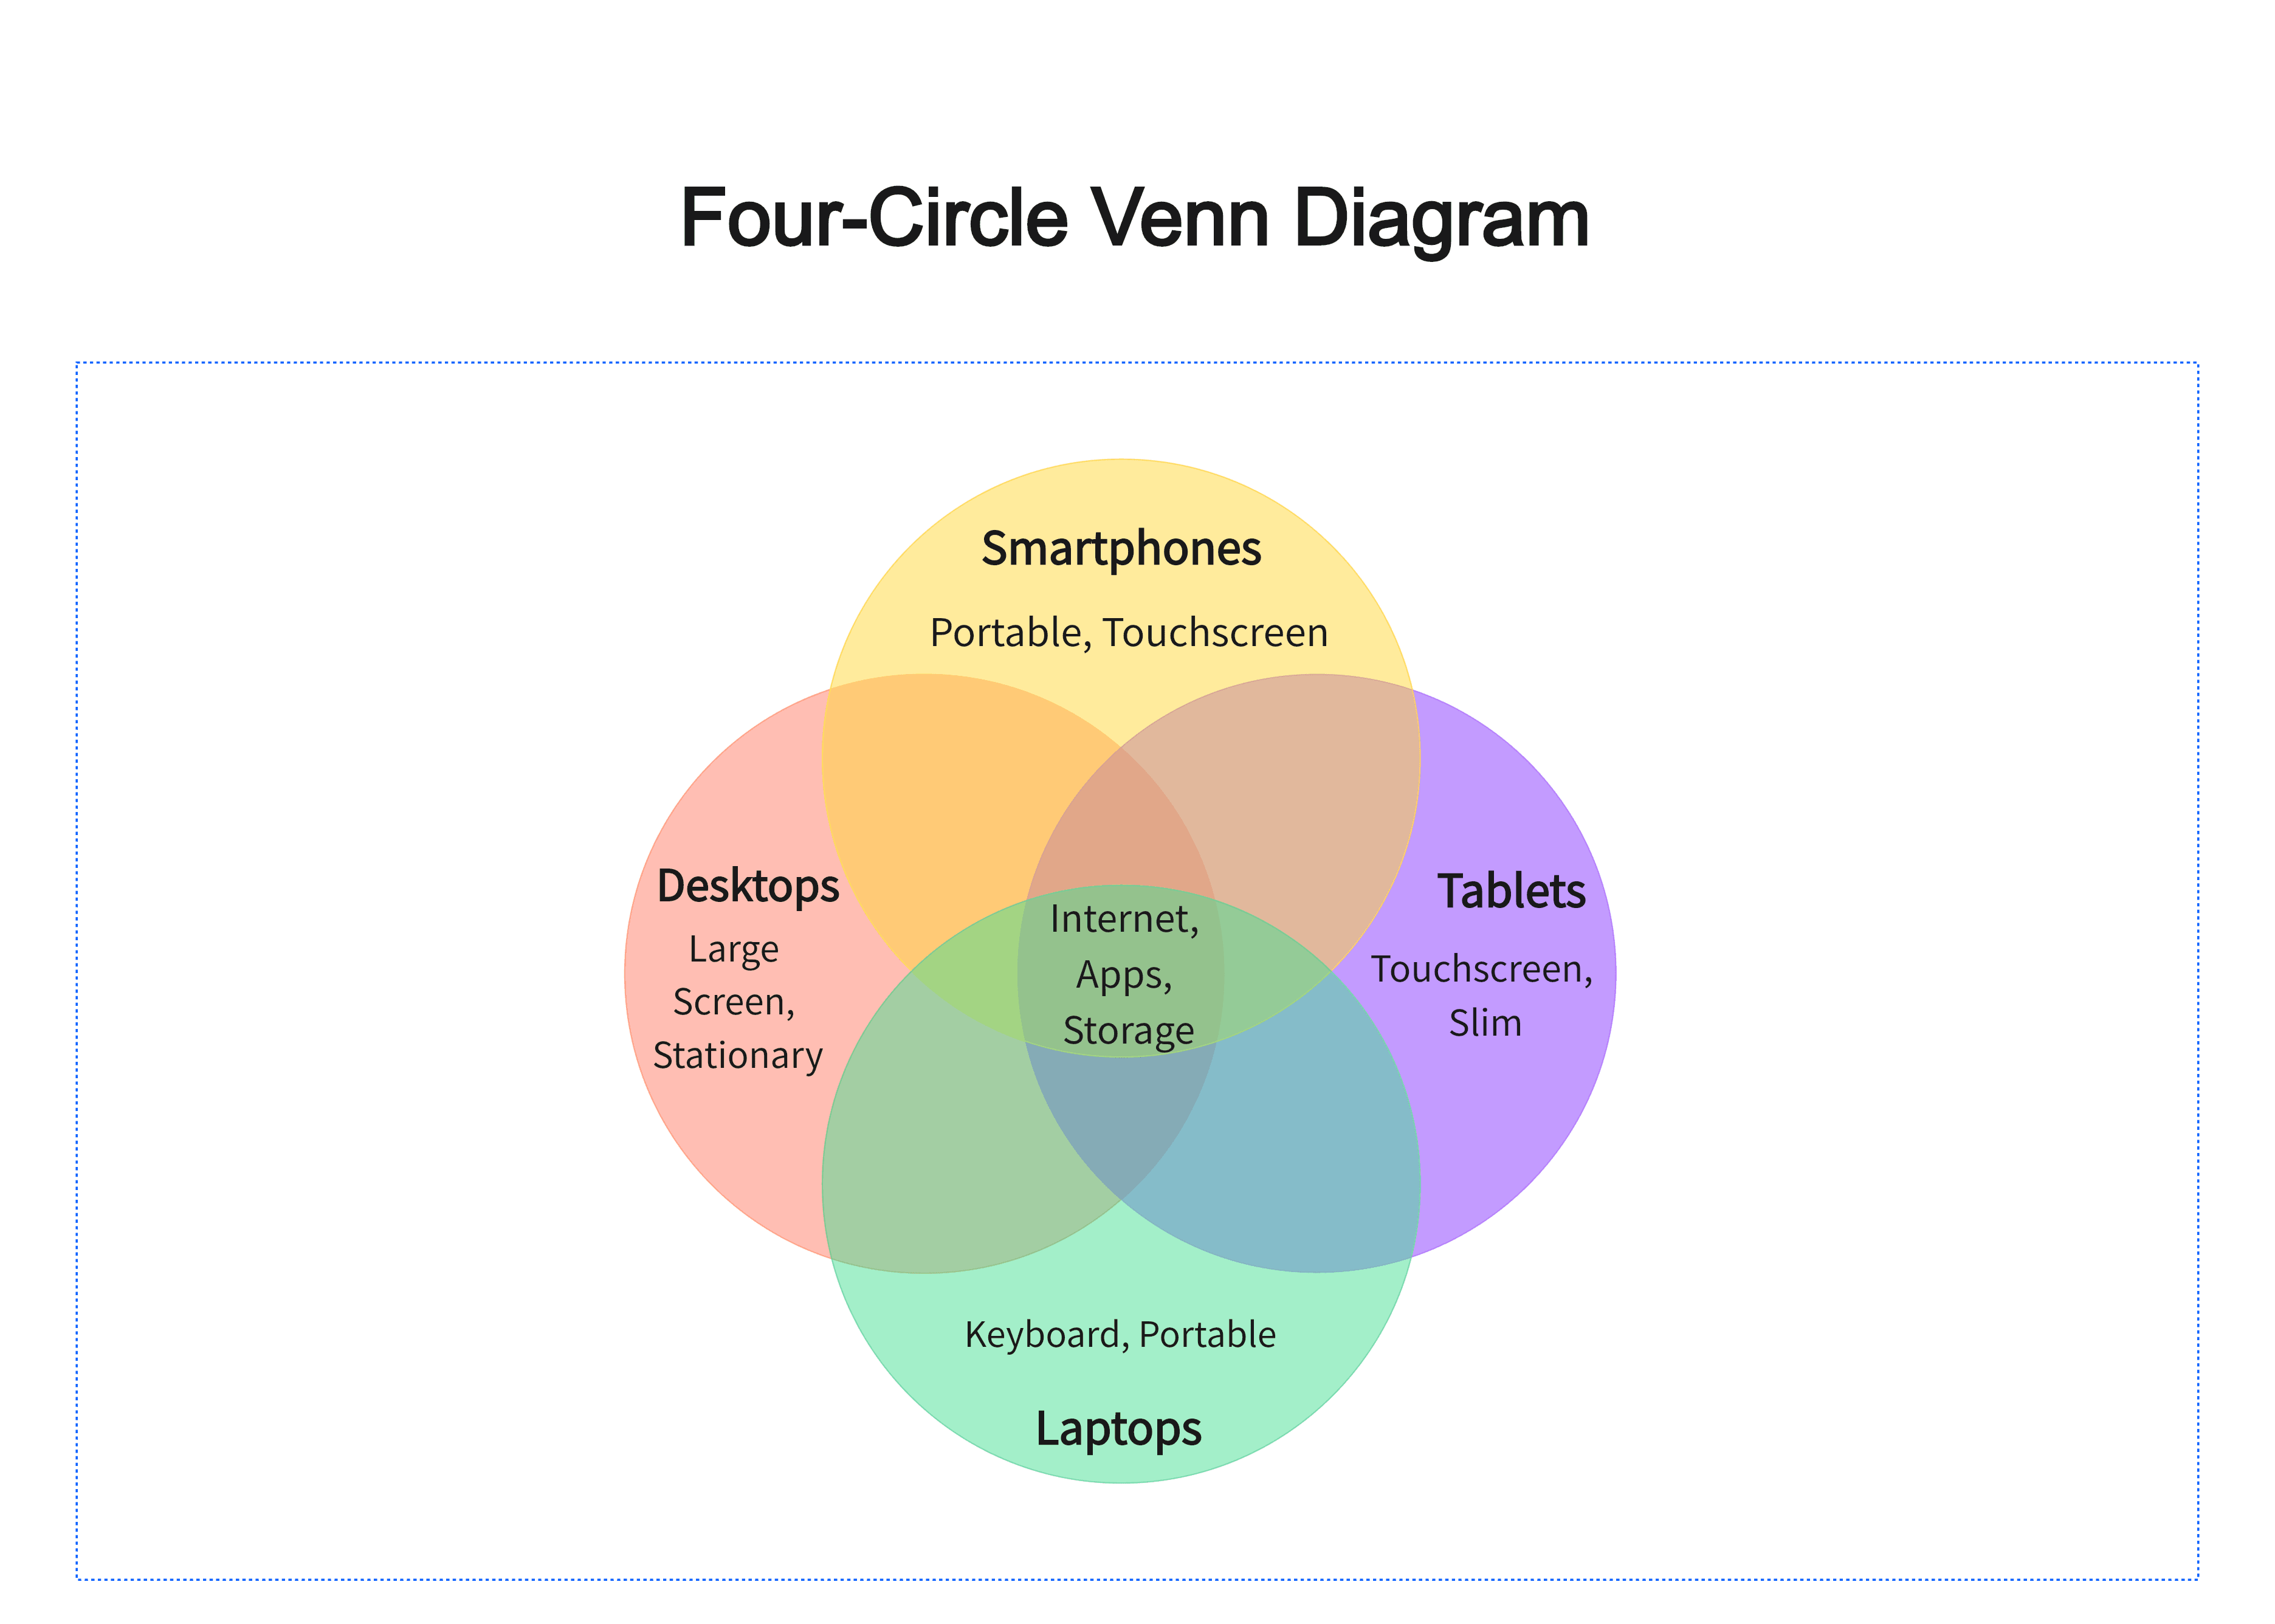
3. Four or More Circle Venn Diagrams
Less commonly used but helpful for comparing more than three sets. This is ideal for more complex analyses, such as market research or product comparisons.
Venn Diagram Example
To better understand how a Venn Diagram works, let’s look at a simple real-world example. Imagine you are comparing two different modes of transportation: Bicycles and Cars.
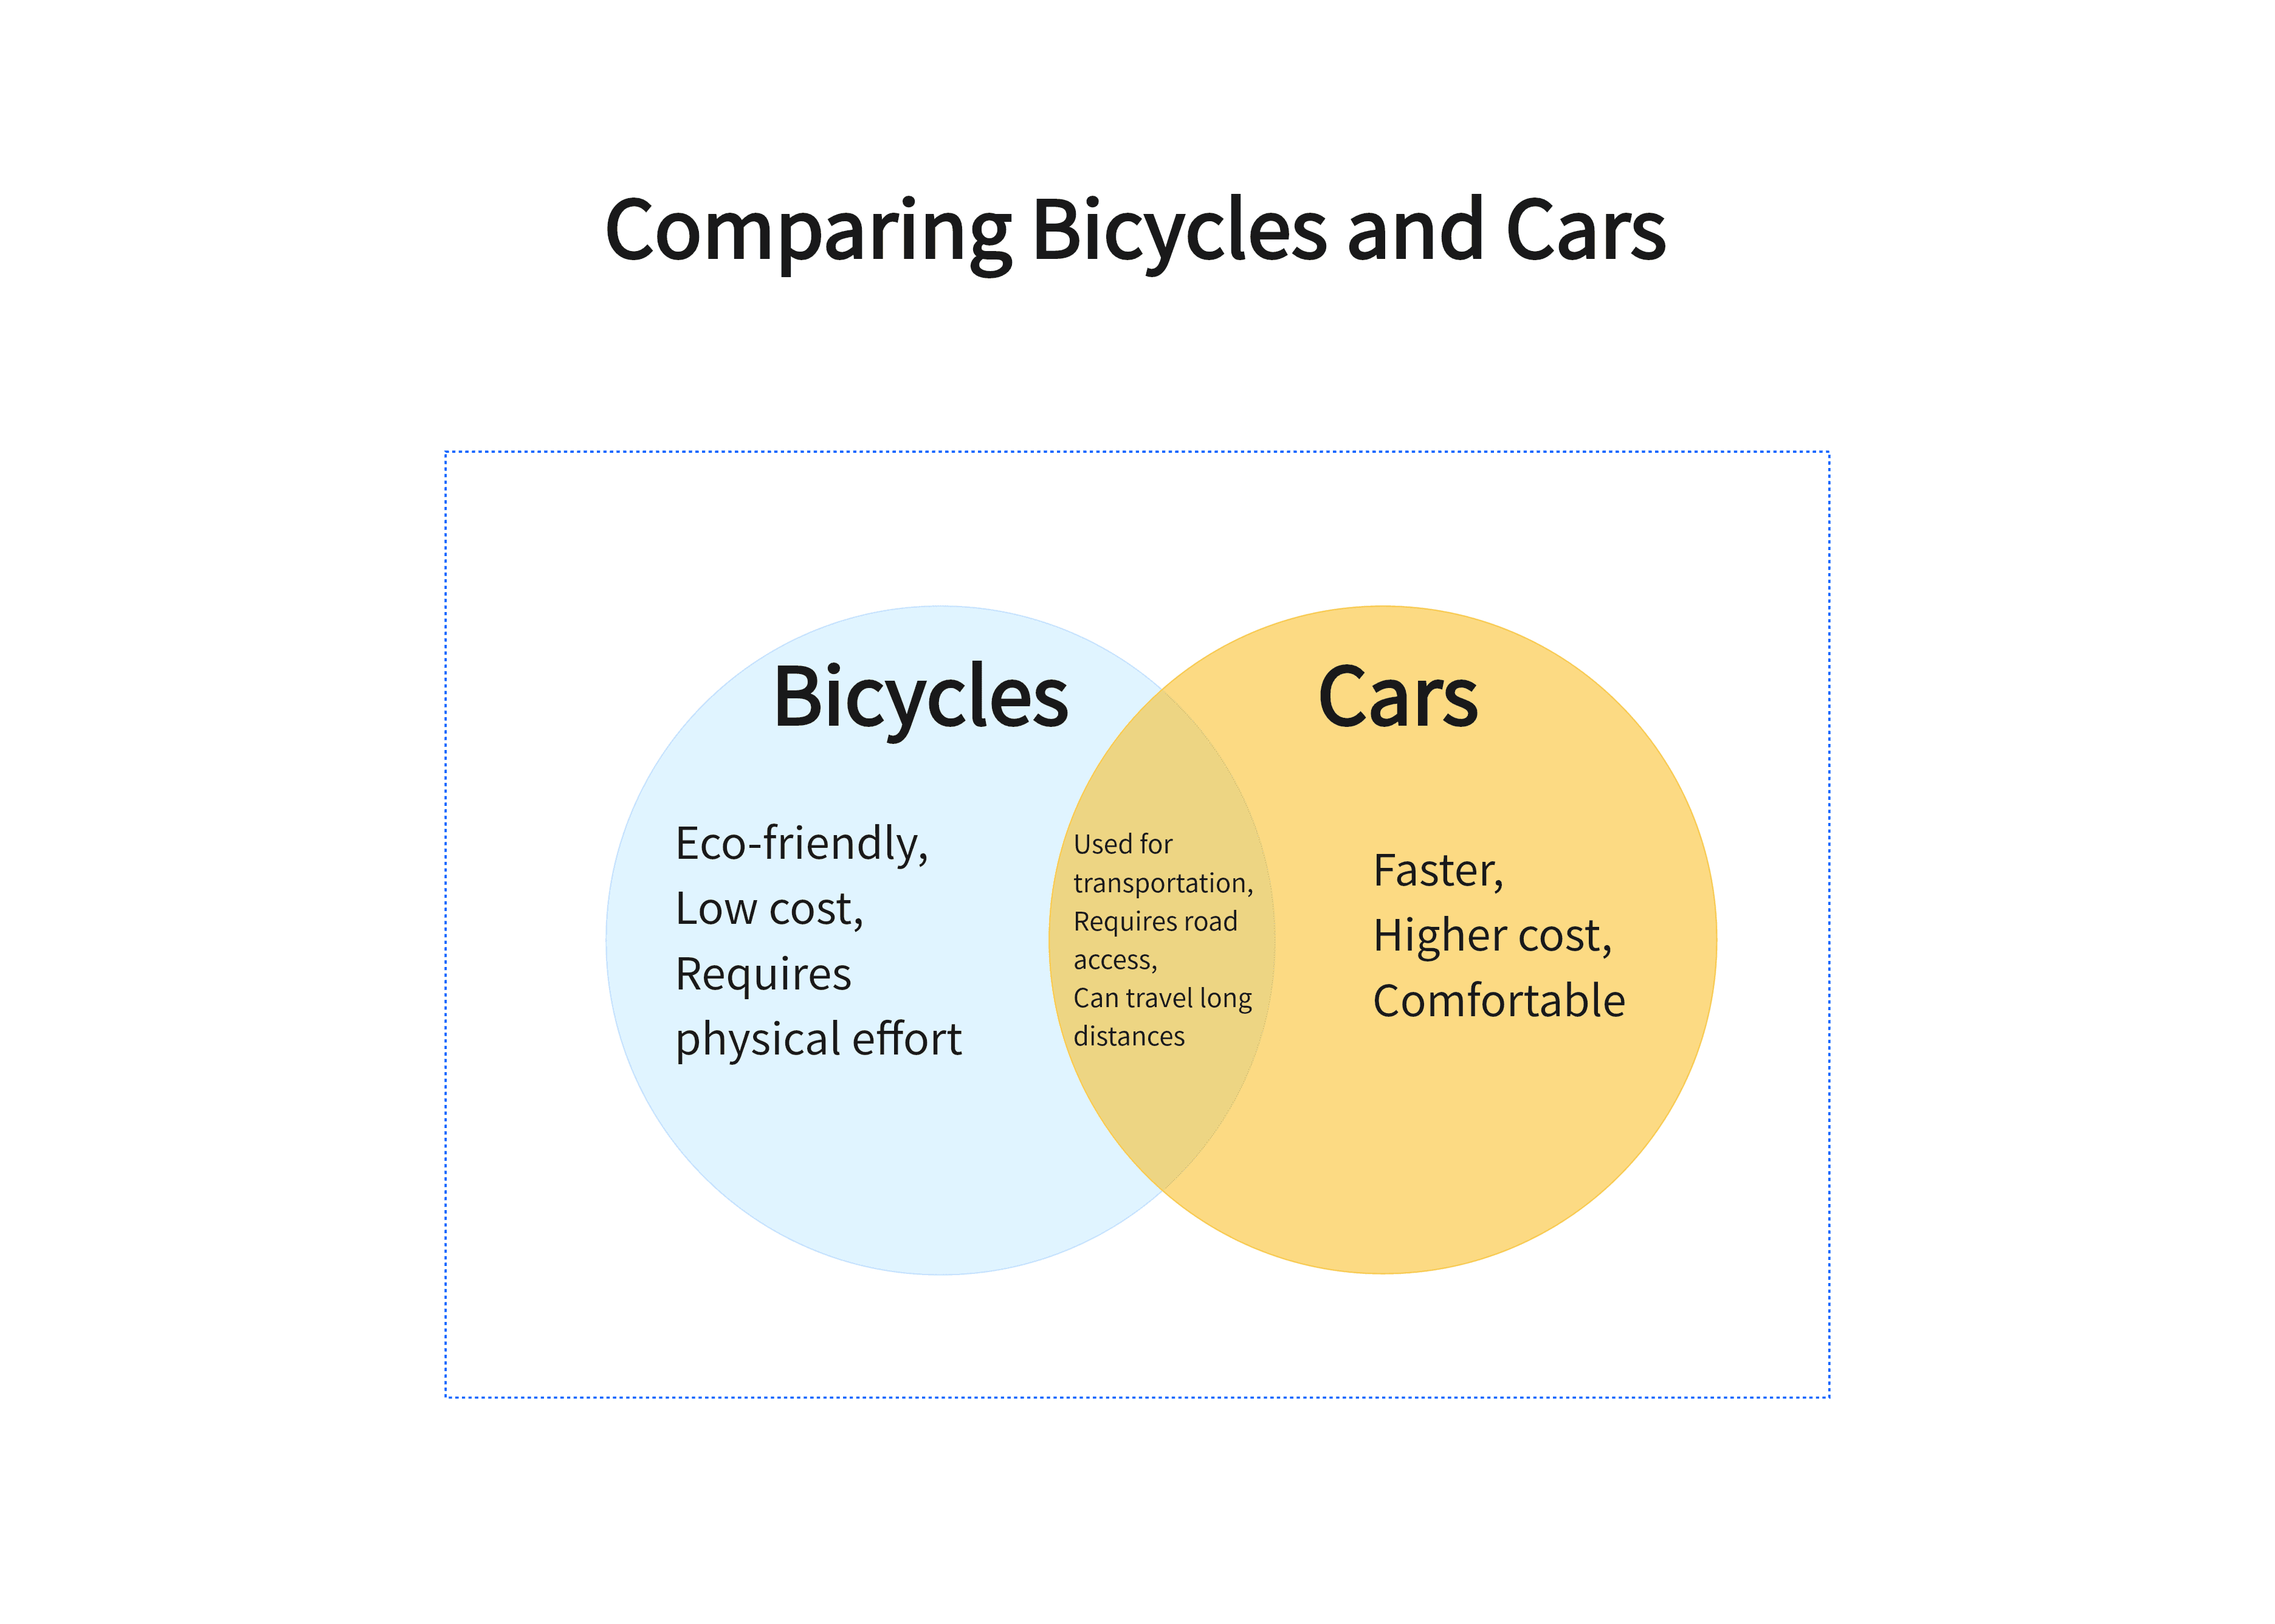
This example shows how a Venn Diagram helps visualize the similarities and differences between bicycles and cars. The overlap reveals the common characteristics, while the unique areas highlight the specific advantages or features of each mode of transportation.
Free Download: Venn Diagram Template
You can download the Venn Diagram Template mentioned above by clicking Use Template button on this page. Customize it to fit your specific needs and preferences.
