You might wonder how companies and organizations map out their long-term strategies. In reality, there are a handful of strategies they can use, but one usually stands out when it is to the growth-share matrix. It’s what they call the BCG matrix. Whether it is about an academic project or you want to study various marketing and strategic plans, this article will guide you all through it.
BCG Matrix defined
The Boston Consulting Group initially created and designed this matrix to assist companies with their strategic planning. Moreover, it aims to help businesses consider their growth opportunities by looking into product portfolios to decide which area to invest, develop, or discontinue products. In most cases, companies have various products, with some of them providing greater sales and returns than others. As some people call it, the Boston matrix will give the business a framework to evaluate the success of every product. Consequently, it will help companies identify which products they must invest a significant amount of money into and which they must eliminate. Furthermore, the BCG matrix will guide companies in identifying new products to introduce to their target market.
Quadrants of a BCG Matrix
In creating this matrix, you will have four quadrants that you need to fill with the necessary information. Here is what each quadrant means.
- Cash Cows. Products under this section are considered the company’s market leaders. They usually sit in the bottom left area of the quadrant. In most cases, they generate more revenue than what they consume. Additionally, businesses aim to carry out as many cash cows as possible. This is because the goods here give the money the company needs to invest in marketing campaigns, cover operating costs, fund product development, and pay debts.
- Stars. The products located at the upper left of the matrix are called stars. They generate the most cash and have the best market share for your business. First-to-market goods usually fall under this quadrant. However, it is noteworthy that stars technically gobble investment because of the higher growth rate.
- Question marks. This section refers to products with higher growth rates and low market shares. It means that they can potentially grow quickly, given that the company invests in them in large amounts.
- Dogs. The products in this quadrant are those with an underwhelming growth rate and market share. They neither consume nor generate a significant amount of money. In some cases, they can lose some money but frequently will break even.
Best 12 BCG Matrix Examples for Students
The Boston matrix examples vary in every creator. Suppose you are looking for some inspiration for school or research projects on this matrix type. These twelve straightforward examples can significantly help you.
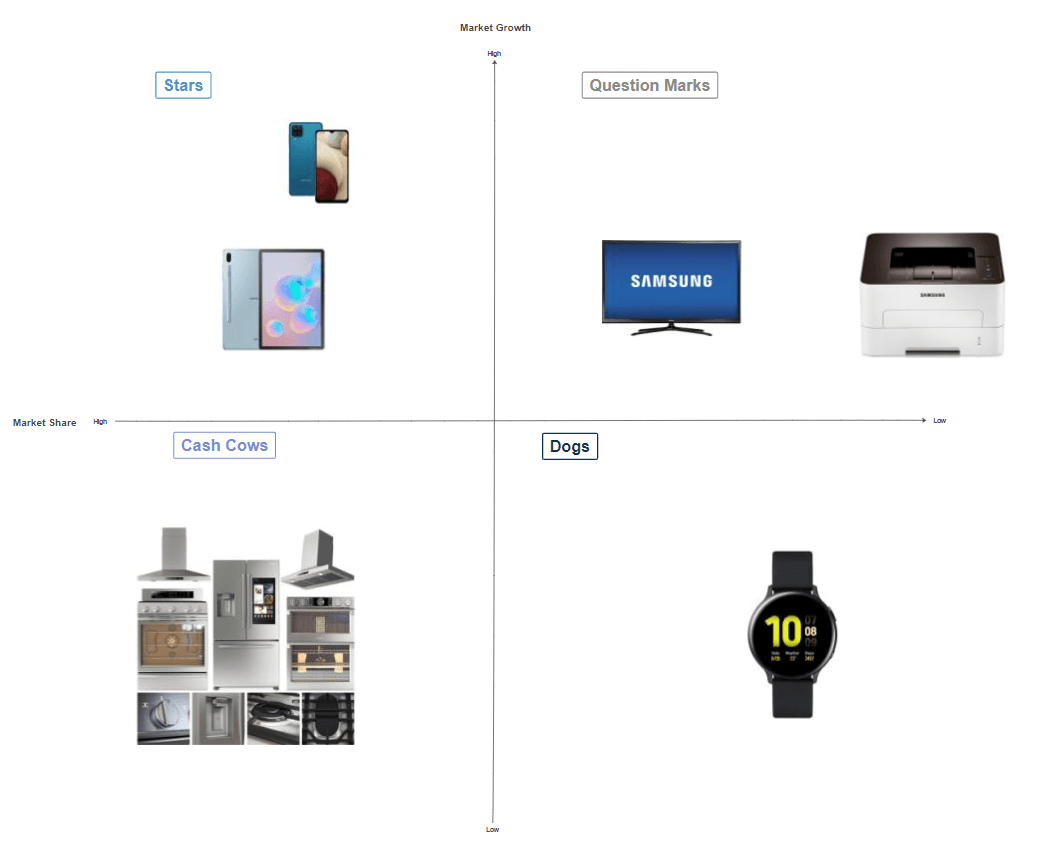
Samsung BCG Matrix
When one thinks of Samsung, the various mobile phones and tablets come to mind. That’s why when you look at the matrix below, these products belong to stars as they generate the most cash and have a higher market share for the company. Additionally, the Samsung Smartwatch lies in the ‘dogs’ quadrant as these products did not meet the expected success they should generate. By looking at the matrix, you can immediately identify why Samsung continues to innovate on mobile phones, tablets, and televisions rather than smartwatches.
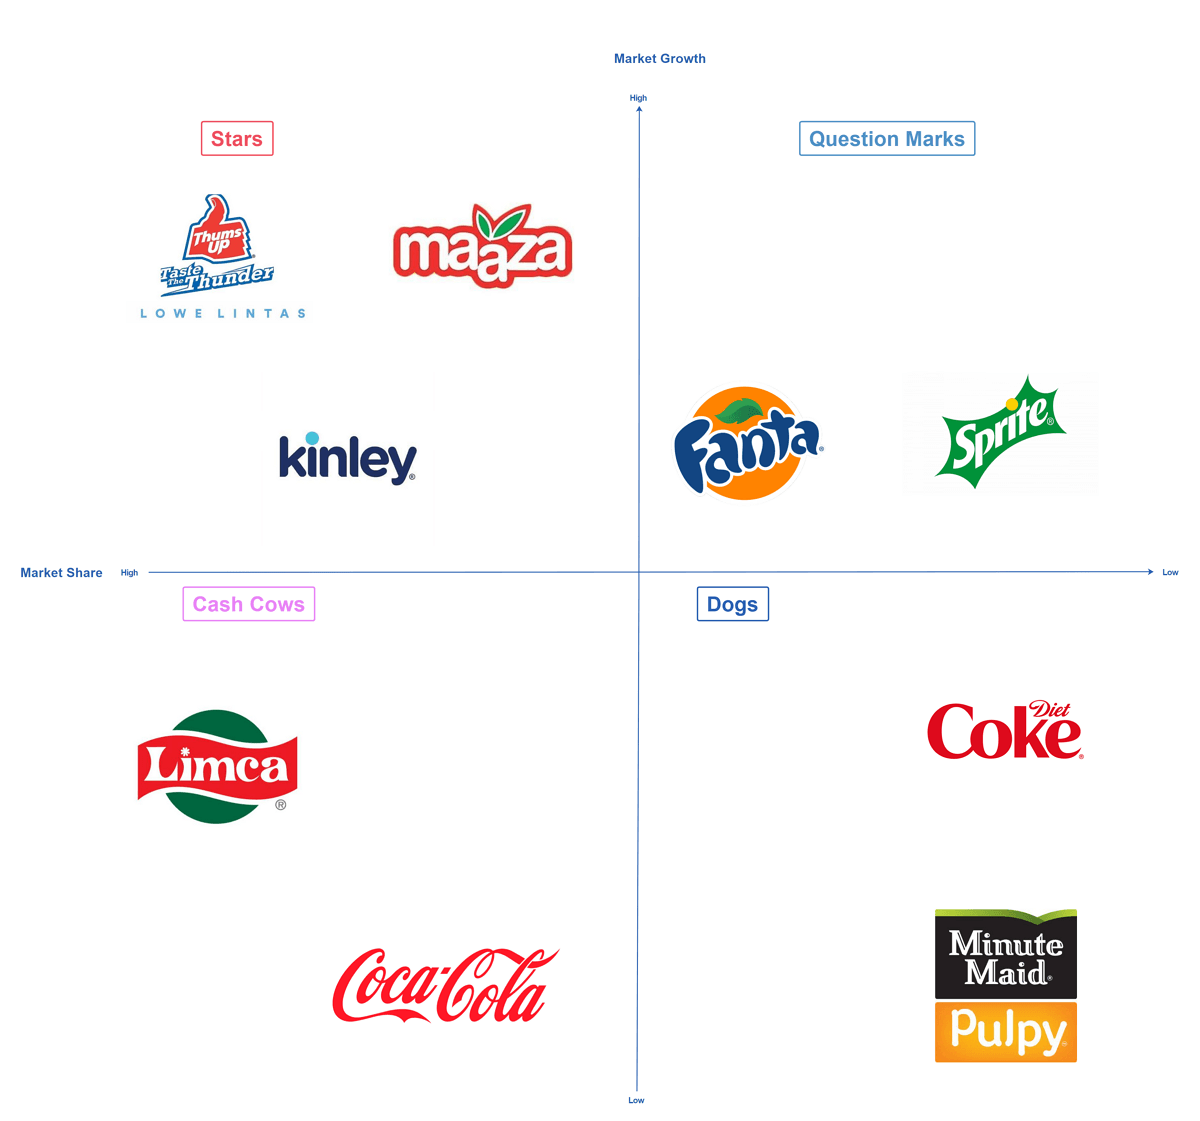
Coca-Cola BCG Matrix
The Coca-Cola Company is famous for producing carbonated drinks. However, looking at the matrix below, it is evident that the company’s water brands are generating much more cash and market shares. Kinley is generally famous in Asian and European countries. Meanwhile, Dasani has a significant following in the United States. Meanwhile, Coke continues to generate substantial cash for the company - the main reason it lies in the cash cow section. However, with the demand for healthier drinks, the company introduced low-calorie beverages, which have not been very successful since its introduction.
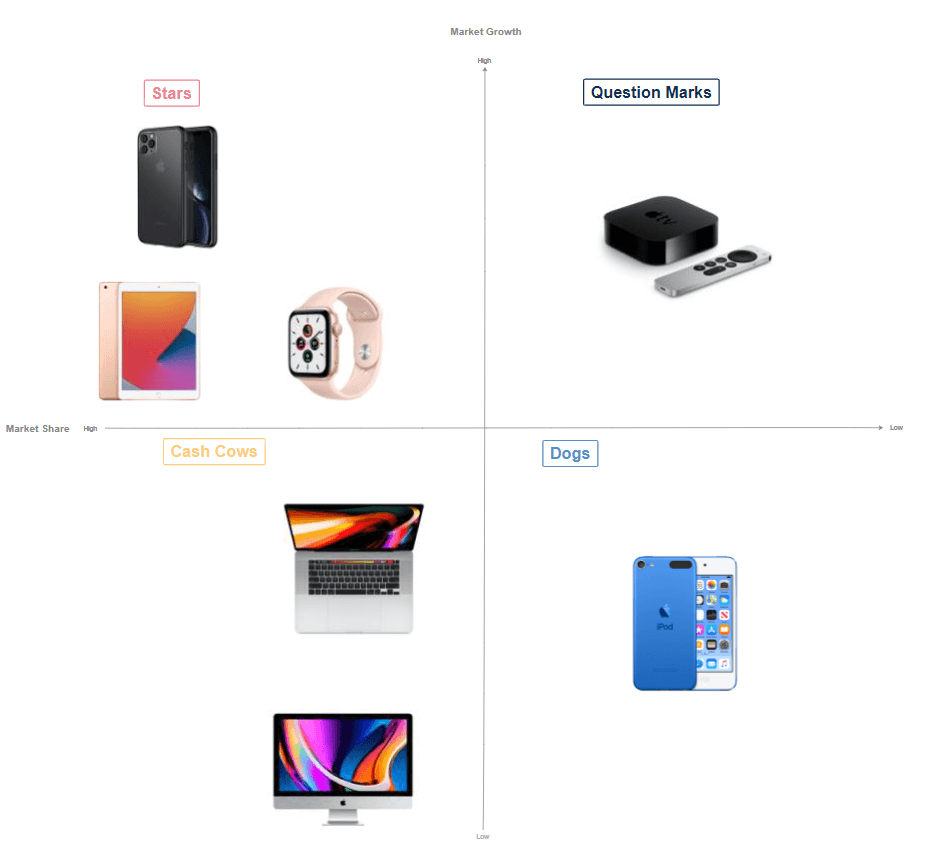
Apple BCG Matrix
It’s no secret that Apple brings one of the most popular mobile phones today with the iPhone. Besides that, the iPad is another generator of significant cash and market share. While Apple laptops generate good profits for the company, it does not belong to a fast-growing industry anymore. Additionally, what was once a popular gadget, iPods, are no longer receiving further significant investments, which is why you can see these products under the ‘dogs’ section of Apple’s BCG matrix.
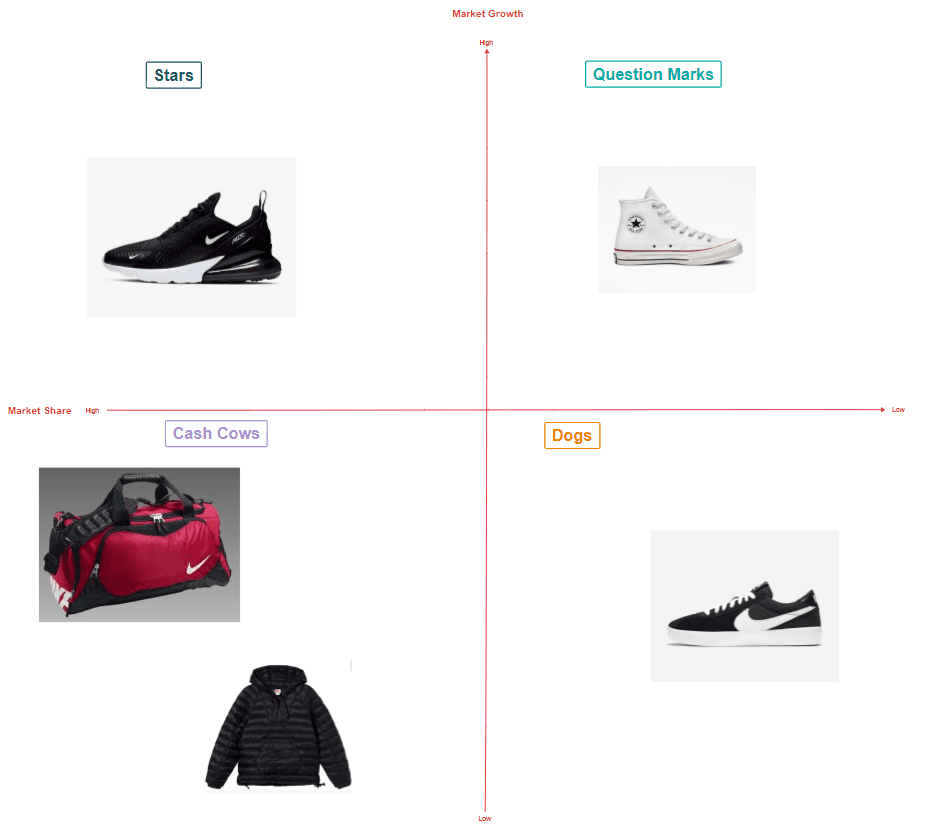
Nike BCG Matrix
Looking at some BCG matrix examples, you cannot count out Nike’s. The company is famous for its vast selection of footwear. Even popular sports personalities don them during their games. Consequently, you can see in their matrix that it is one of the company’s leading profit and market share generators. While footwear might be the leading sales generator for Nike, it is not the case for its Nike Skateboarding (SB). Nike SB is not considered to be the core skateboarding brand and did not get that much support from its target market.
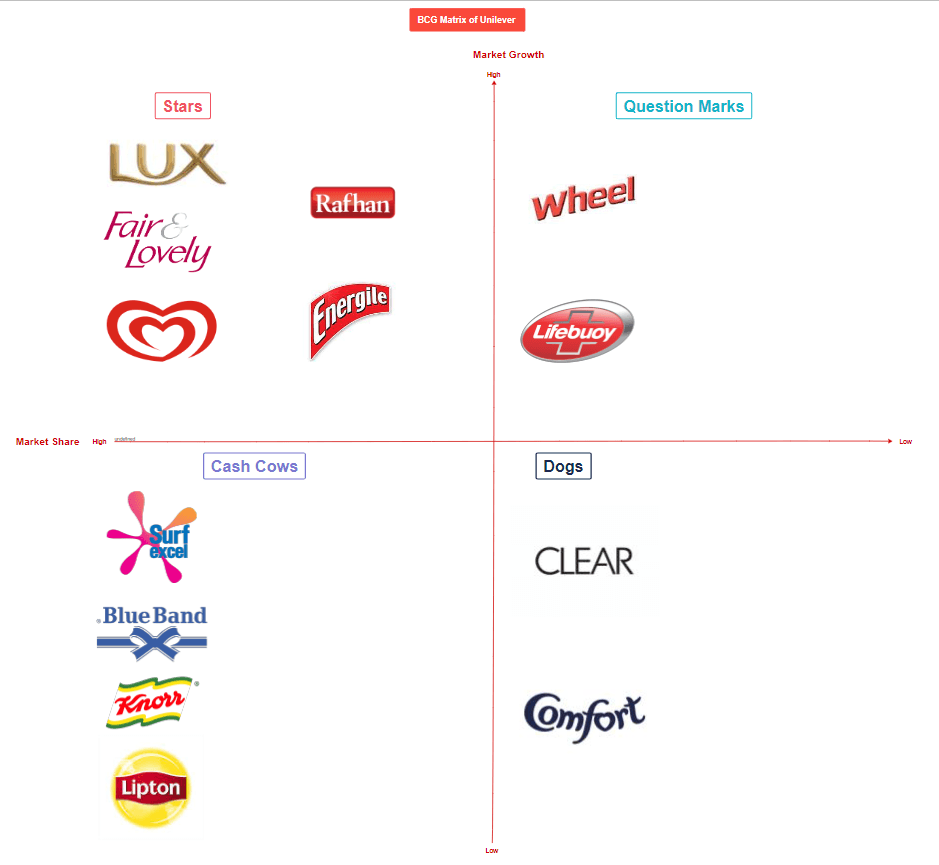
Unilever BCG Matrix
Unilever boasts various brands - some are still in the market, while others were already eliminated. Personal care brands like Sunsilk and Lux look to be under the stars quadrant for the company. Surely the competition in this niche is challenging, with other companies introducing new brands and products. However, some of Unilever’s products like Close-Up, Lipton, Knorr, and Rexona are still making significant sales and revenue for the company.
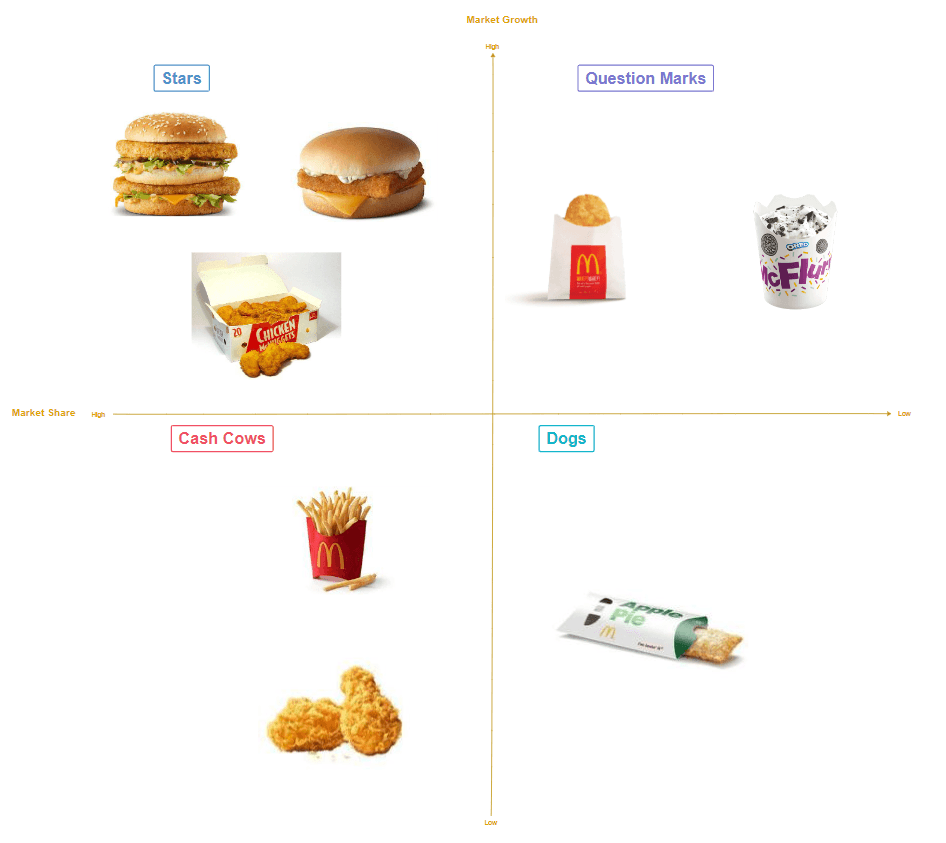
McDonald’s BCG Matrix
It’s no secret that Mcdonald’s is famous for its burgers. Looking into the company’s BCG matrix, besides burgers, their McFlurry is also one of the significant sales and market development generators. Despite being the go-to drink for breakfast, Mcdonald’s coffee does not sell well. There’s just not much uniqueness with the product making the company not invest much cash in carrying it into the market, in making it more visible and appealing.
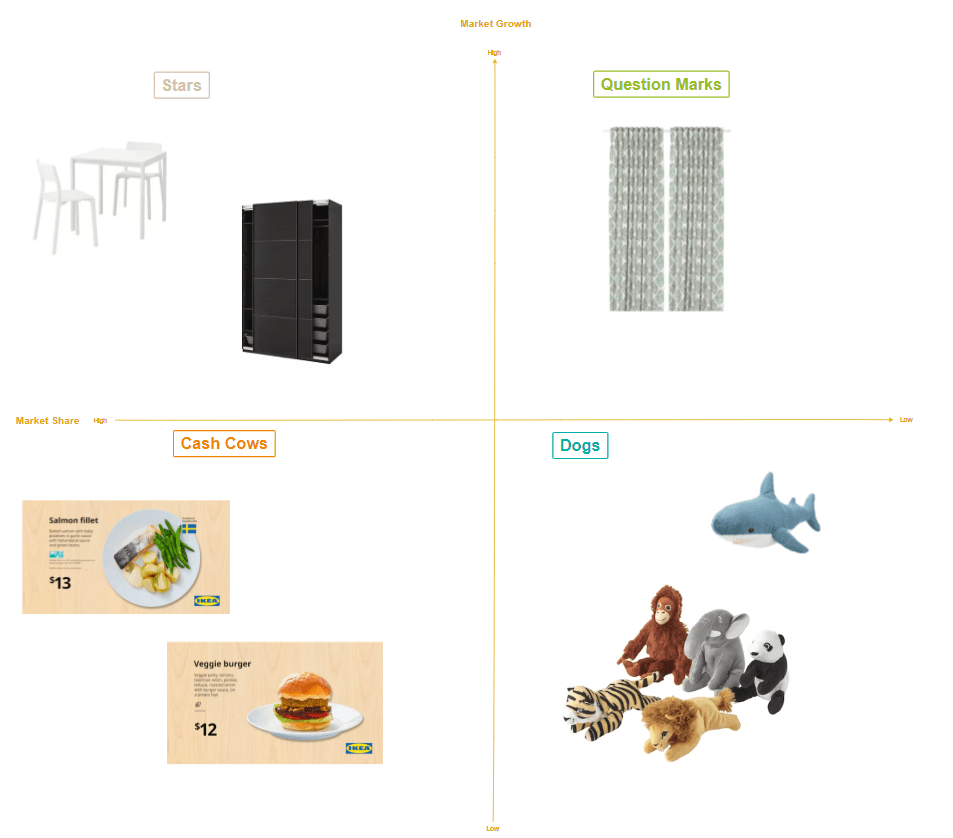
IKEA BCG Matrix
IKEA is more than just furniture. This may be new to some who knew IKEA because of its furniture. Surely the company prides itself on providing ready-to-assemble furniture, making it the leading sales driver. Additionally, the company sustains its mastery in this department by responding to trends and satisfying customers in the same way. Besides furniture, IKEA also turned to its food menu to generate considerable sales and market share. Also, toys are still available at the store. However, looking at the matrix example, you can see that toys belong to the ‘dogs’ section. This means that these particular products do not provide significant returns to the company.
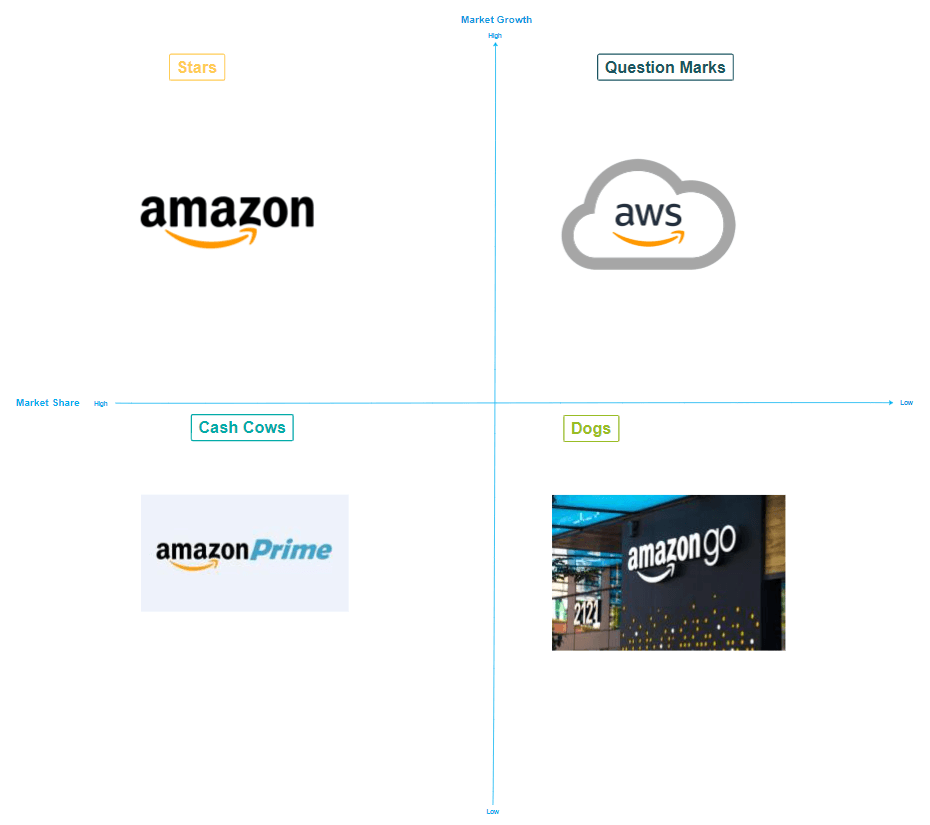
Amazon BCG Matrix
Amazon is an e-commerce giant that provides more than just an avenue for shopping goods. Despite their low market shares, Amazon Music and Prime Video had a relatively high growth rate. Hence, you can see that they fall on the “Question Marks” quadrant. At the same time, these two Amazon products fall under the “Cash Cows” quadrant. This is because they were launched in the market when Netflix and Spotify were already present, which they consider their rivals. Only Amazon does not have something under the “dogs” section with all the Boston matrix examples. This is because most of the company’s products have a relatively decent growth rate.
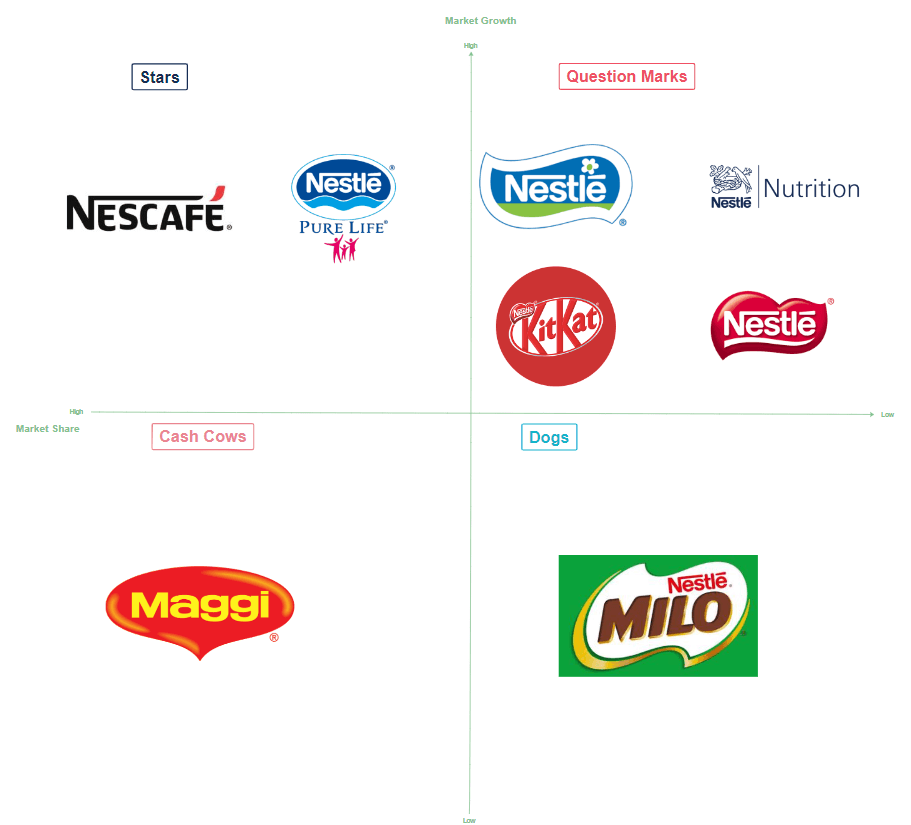
Nestle BCG Matrix
Nestle’s most prominent players are the company’s mineral water and Nescafe coffee. These products are the ‘stars’ of the company, providing a higher growth rate and market shares. Surely, you might have associated Nestle with milk products. Yes, the company’s products are still there. However, it might be noteworthy that they still have yet to solidify their position on the market. Hence, you can see them under the “Question Marks” quadrant. On the other hand, Milo might be famous in some countries; however, it has failed to generate a significant impact for Nestle.
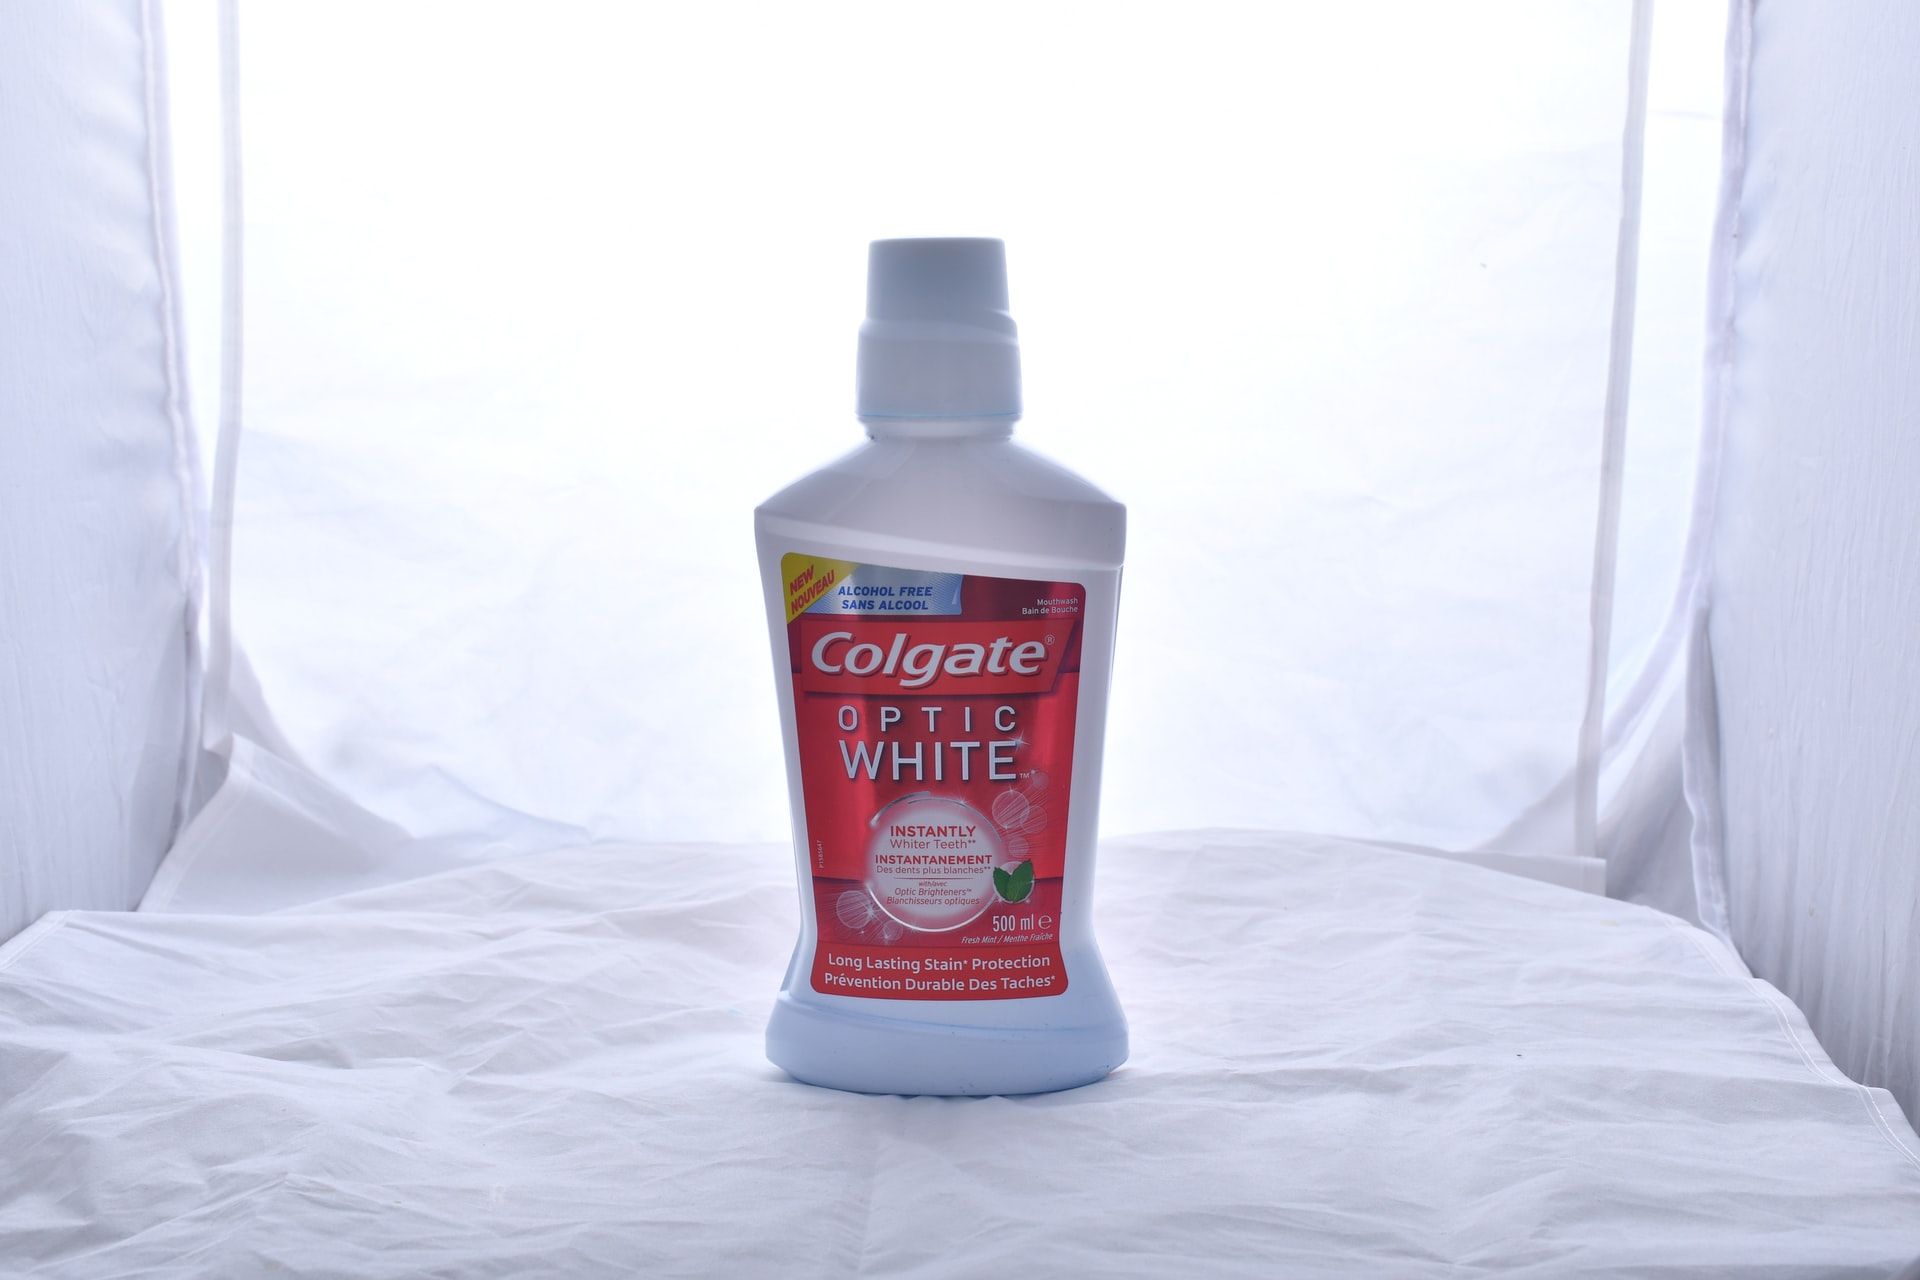
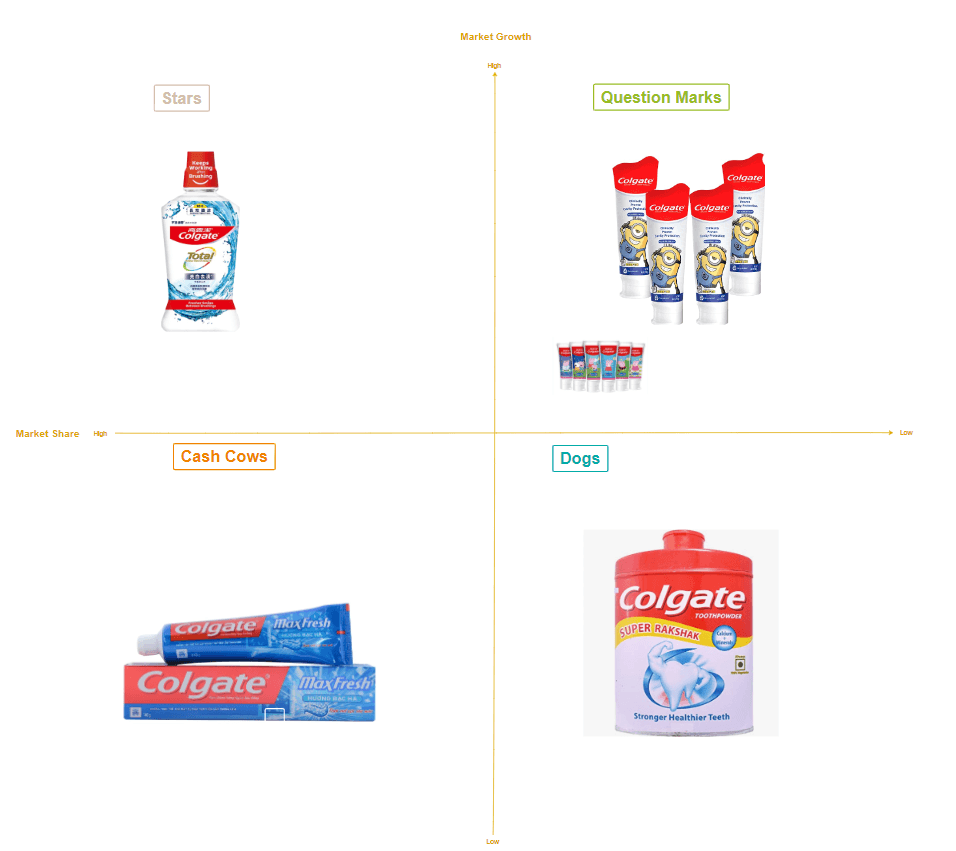
Colgate-Palmolive BCG Matrix
Talking about one of the leading oral care brands, you can indeed include Colgate. The company’s BCG matrix prides itself on toothpaste, mouthwash, and toothbrush products being the top drivers for market share and growth rate. While adult toothpaste is performing well, it is not the case for those designed for kids. Hence, you can see from the matrix that it’s under the ‘Question Marks’ quadrant. Though introduced to the market, the brand’s toothpowder has not yet generated the expected growth rate for the company.
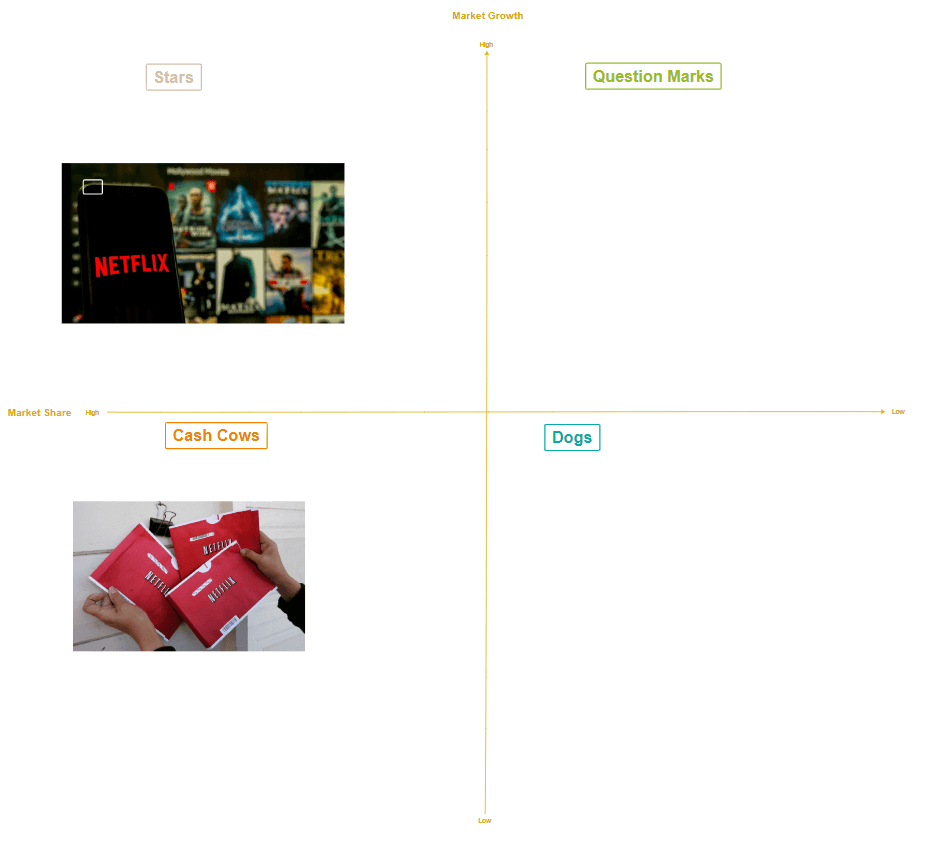
Netflix BCG Matrix
More and more people are turning to online streaming instead of standard DVDs. Hence, the increasing popularity of Netflix. The content which boosted the company’s subscribers includes Stranger Things, The Crown, 13 Reasons Why, etc. Besides these shows leading to increased streaming and subscription, people started to prefer online streaming rather than the traditional cable networks. Additionally, despite the increase in online streaming, Netflix still holds the highest subscription rates for DVDs. When making a BCG matrix, you can leave out some quadrants if you see nothing wrong with the products, just like the example below.
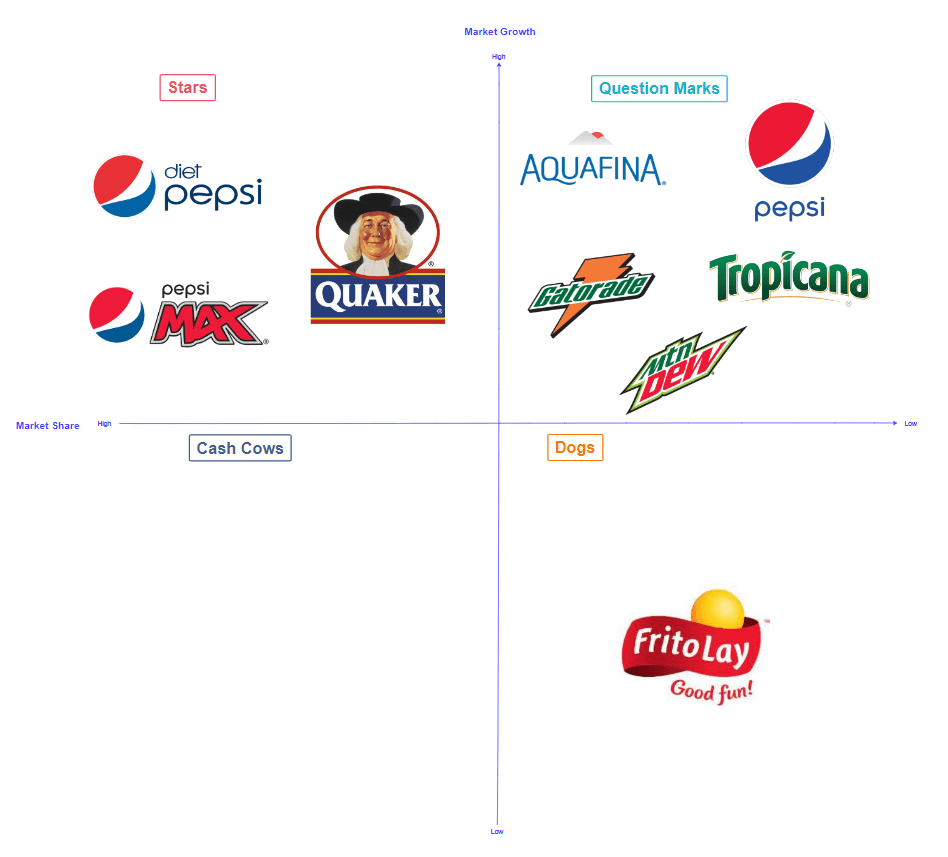
PepsiCo BCG Matrix
Pepsi or PepsiCo is more than just beverages. This also has a vast selection of brands that have made significant brand positions in the market that they serve. Looking at the matrix below, the company still thrives with its beverages, including Pepsi, Mountain Dew, and Aquafina. These serve as the leading generator of higher market share and growth rate. Also, if you have tried Cheetos, Lay’s, and Doritos, they are products of PepsiCo. They continue to generate good long-term revenue for the company.
Create a comprehensive chart using BCG Matrix Examples
It can be overwhelming to look at those BCG matrix examples. However, as you read them individually, they are practically very straightforward. Moreover, the matrix simplifies how companies determine what products work well and those that do not. You might not be able to use all of them, but it pays to have various options for your following projects. Time will only tell that you might need all the examples given above.
Remember that as you create your version of the MCG matrix, you can add more elements in every quadrant, however, you prefer it to be. Also, there are various online tools that you can use to enhance your matrix. Some software would allow you to put colors, boxes, designs, and stickers for every section for proper identification.