Introduction
The BCG revenue matrix is a business model that assists firms in analyzing their business units (i.e., product lines) or any other cash-generating entities based on their level of profitability. For example, an Amazon BCG Matrix.
Businesses and corporations frequently use this graphic as a tool for corporate growth. As a result, it sometimes also comes up as the Growth/Share matrix, based on the idea that increasing marketing spending will increase market share.
The BCG Matrix is the most used portfolio analysis methodologies and organizes a company's products and services into a two-by-two matrix. Each is labeled as poor or high performance depending on the relative market share and market growth rate.
In this report, we shall explore the BCG Matrix of Amazon and the history behind its multi-dollar online venture.
Amazon Background
Amazon.com is the top-earning Internet-based business that sells literature, music, movies, furnishings, electronics, toys, and various other products directly or as an intermediary between different shops and Amazon's millions of consumers. Its Web services business comprises renting data storage and computing power over the Internet, known as "cloud computing." Its web presence is so significant that in 2012, 1% of all Web traffic in North America passed via Amazon.com data centers.
In addition, the firm manufactures the market-leading Kindle e-book readers. The marketing of these products has resulted in a tremendous increase in e-book production, transforming Amazon.com into a critical disruptor in the book-publishing sector.
| Company | Amazon |
| Industry | E-commerce Cloud Computing Artificial Intelligence Consumer electronics Entertainment Digital Distribution Self-driving cars Supermarket |
| CEO | Andy Jassy |
| Founded | 5-Jul-94 |
| Location | Bellevue, Washington, United States |
| Revenue | 386.1 billion USD |
Amazon BCG matrix
In 2019, Amazon Music had a 15% market share, while Spotify had a 36% market share. Netflix has the most market share in Prime Video. These items have a low market share but a rapid growth rate. Therefore they fall into the Question mark class. If these goods obtain financing, they have the potential to become "Stars." Since prime and music got introduced into the market while their competitors existed, they have mostly served as Cash Cows. These goods were new and released in a new market since Amazon was essentially an e-commerce behemoth. As a result, it was variegation.
When talking about the BCG matrix of Amazon, both the Kindle and Alexa are stars. Although the Kindle does not make as much income as other items, it is the market leader in the eBooks area. Alexa faces competition from Google Home, but it still has a significant market share and generates a lot of money. Both of these items were new to the market, but the market was not. Therefore it was product development.
Amazon's e-commerce is also a star because it has the largest market share. Amazon was the first e-commerce website to be founded in 1994. Diversification applies since both the product and the market are new.
Amazon does not offer any dog-related items because most of its products have a reasonable growth rate.
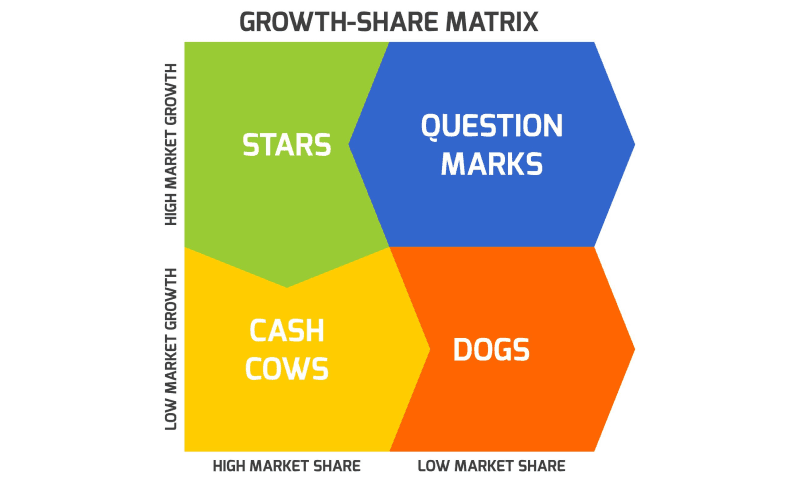
Image Source: https://www.investopedia.com
Star
Stars are the company units or goods with the largest market share and generate the most income. Monopolies and first-to-market items are usually referred to as Stars as well. On the other hand, stars consume a lot of money because of their rapid rise. This usually results in the same amount of money coming in. Stars in the Amazon BCG Matrix can ultimately become Cash Cows if they maintain their success until a high-growth market slows down. Investing in Stars is a crucial pillar of a BCG growth strategy.
Question Marks
These areas of a company have significant development potential but a tiny market share. They spend a lot of money yet produce nothing in return. Question Marks cost businesses money. However, because these business units are quickly expanding, they have the potential to become Stars in a high-growth industry. Companies like Amazon are urged to invest in Question Marks if their goods have growth potential or sell if they do not.
Cash Cows
A Cash Cow is a market boss that earns more money than it spends. Cash Cows are business units with a significant market share but little room for expansion. Cash Cows offer the funds necessary to transform a Question Mark into a market leader, cover the company's administrative costs, support R&D and corporate service debt, and pay dividends to shareholders. As per the BCG Matrix of Amazon, it should invest in Cash Cows to sustain current production levels or passively "milk" the profits.
Dogs
Dogs, often known as Pets, are units or items with a small market share and poor growth rates. They typically break even without earning or spending much money. Dogs are generally seen as financial traps since businesses invest money in them while receiving nothing in return. These company divisions in the Amazon BCG Matrix are excellent prospects for sale.

Image Source: https://unsplash.com/
How to Use BCG Matrix in Your Business
The BCG Matrix of Amazon can assist you in determining which goods you should prioritize and which ones you must eliminate.
Here are four ways you can use the BCG matrix to strategize for your company:
Strategy One: Lower your investment and extract as much cash flow as possible from a product, increasing its total profitability. This method works best for Cash Cows.
Strategy Two: Significantly raise the stake in Stars and Question Marks if you want to focus on innovation.
Strategy Three: If you cannot invest more in a product, maintain it the same and ignore it. A Cash Cow can be a well-established commodity that requires less work to sustain.
Strategy Four: Invest the money you would have spent on a product somewhere. This method is best suited to Dogs.
How to Convert PDF Reports Using PDF Agile
This PDF converter offers customers an easy way to set up a customized e-filing system. Users can also better handle PDF files and document metadata. This PDF converter has the following features:
- Users can effortlessly convert Word, Excel, PowerPoint, TXT, pictures, and CAD files to and from PDF without losing formatting.
- PDF documents can be organized and manipulated by users to complement their processes. Split and combine documents; easily apply stamps, watermarks, headers, and footers; drag and drop pages inside a folder or from one document to another.
- Users can improve their digital reading experience by switching between three distinct settings for all circumstances. Reader Mode, Full-Screen Mode, and Slideshow are accessible with a single touch.
Key Takeaways
Live e-commerce is rapidly expanding. Amazon Live in the BCG Matrix of Amazon is a Question Mark product in a hyper-growth sector with a low market share and poor market growth. Amazon Live may become a household name with the appropriate resources and approach. However, if the market circumstances do not adequately appraise, it may degrade into a Dog product.
References
Brand Minds, global thinkers business summit. Available at: https://brandminds.live/bcg-growth-share-matrix-for-amazon/