Introduction
The Boston Consulting Group growth-share matrix, or BCG for short, is a planning tool that employs graphical representations of a business's goods and services to assist the organization in deciding what to maintain, sell, or spend more in.
In a four-square matrix, the BCG matrix in marketing depicts a company's offers, with the y-axis indicating market growth and the x-axis representing market share. The Boston Consulting Group pioneered it in 1970 and brought out the BCG revenue matrix. This business model helps companies analyze their business units (i.e., product lines) or other money entities depending on their profitability level.
This framework is commonly used for corporate growth by enterprises and corporations. As a result, it is also famous as the Growth/Share matrix. It is predicated on the same premise that increased marketing investment will increase market share.
The BCG Matrix is a famous portfolio analysis methodology. It is a two-by-two matrix that arranges a company's goods and services wherein each quadrant gets categorized as poor or good performance based on its market share and growth rate. In this article, you shall be looking at the analysis of the BCG matrix in marketing.
Background of Marketing
The contemporary definition of 'marketing' that first appeared in dictionaries dating 1897 is a process of moving goods from producer to consumer, emphasizing sales and advertising. Marketing derives from the Latin word, Mercatus, meaning marketplace or merchant.
The most well-known business portfolio analysis tool is BCG. It gives a graphical depiction for an organization to assess various firms in its portfolio based on their market share and industry growth rates. It is a two-dimensional examination of SBU administration (Strategic Business Units). In other words, it is a comparative comparison of business potential and environmental assessment. This matrix categorizes businesses as high or low based on their market growth rate and market share.
A strategic business unit, or in short, an SBU, is a fully functional business unit with its vision and direction. A strategic business unit often works as a distinct entity, but it is also a significant aspect of the firm. It communicates its operating status to the headquarters. SBUs are essential concepts to grasp if you genuinely intend to understand the marketing BCG matrix.

Relative Market Share = SBU Sales this year leading competitors' sales.
Market Growth Rate = Industry sales this year - Industry Sales last year.
You must calculate both measurements for each SBU according to the BCG marketing matrix. The relative market share component of corporate strength will assess comparative advantage as shown by market dominance. The basic assumption underpinning this is the presence of an experience curve and the achievement of market share through overall cost leadership.
BCG Matrix in Marketing
The marketing BCG matrix is straightforward to comprehend. Larger firms may use it to find volume and experience impacts. Since it forecasts a company's future activities, the organization can determine the best management plan. It is a valuable tool for analyzing a company's product portfolio selections.
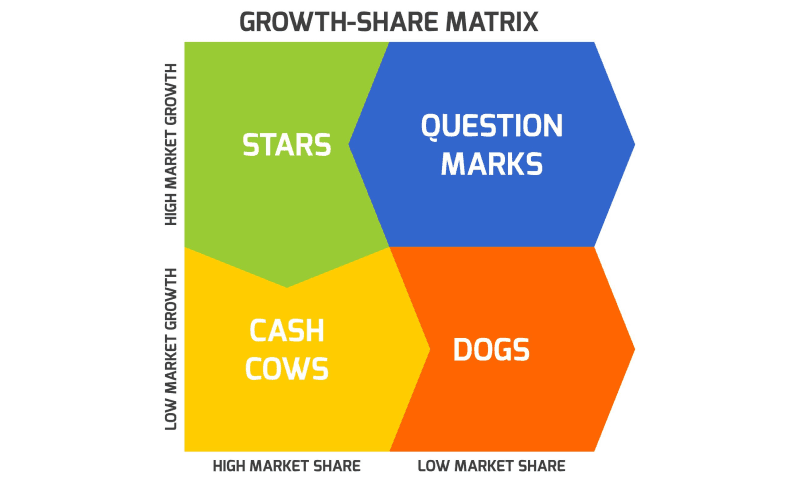
The cash flow is highlighted in the matrix, as are investing features. Managers may use this tool to assess the firm's current inventory of Stars, Cash Cows, Question Marks, and Dogs for balance.
The matrix shows that the company's earnings are proportional to its market dominance. As a result, if a firm appears profitable, it might grow its market share. Finally, it contains only four categories, making it easy to understand.
Cash Cow
Cash cow items in the BCG marketing matrix are worthy of your consideration. Cash cow brands (or goods) are frequently well-established, in constant demand, simple to create, and tremendously profitable.
Because Cash Cow goods don't need a lot of effort to retain a significant market share, any company should build one to provide a consistent income stream.
A business must milk these Cash Cow products well enough for the money. This money may then be invested in "star" items to help them become the market leader and create a better return on investment.
Star
Star items are market leaders with the highest return on investment than other products in the marketing BCG matrix. They do, however, require continuous investment to preserve their market leadership position.
Stars are both enormous money makers and large money consumers. Thus, they flourish in fast-growing markets, and companies should spend extensively on Star items or brands.
Star items that are well promoted can become cash cows. If a star product is very inventive, it may struggle from market volatility and flop.
Question Mark
Question Mark items are the most challenging to predict whether they will be successful. They frequently have a tiny market share and spend a large amount of cash and financial resources.
They have the potential to become Stars with significant funding behind them. If they fail to find momentum in a fast-growing industry, they will become dogs.
Question Mark products can become significant losers in the market and are frequently the "problem kid." As such, you must closely monitor them.
Dogs
Dog items or brands have minimal market share and growth, as seen in the BCG marketing matrix. These are not worth additional investment since they will deplete resources for little gain in market share.
While "Dogs" do not cost much to create or advertise, they also yield little profits. They can waste time and money by tying up resources with little long-term value.
Look away from "Dog" items unless they complement or improve the performance of other products in a company's portfolio.
Convert PDF Report Using PDF Agile
The Agile PDF converter is a tool that provides users with a simple solution to create their marketing business report, manage PDF files, and document information more effectively. Other functions of this PDF converter include but not limited to;
- Converting different files from and to PDF without losing formatting
- Manipulating and organizing PDF pages to support their workflows.
- Enhances users’ digital experience in reading
Key Takeaways
The Boston Consulting Group initially designed the BCG marketing matrix or growth-share matrix in the 1970s as a portfolio planning tool or corporate planning tool. The idea relied on a four-quadrant classification system for a company's strategic business units (SBUs) or products/brands.
The quadrants are divided into "market growth" and "market share" combinations, giving rise to the terms "growth-share matrix" and "growth-market-share matrix." On both the x- and y-axes, the matrix is graded from low to high. The x-axis usually represents market growth rate or cash use, while the y-axis represents relative market share or cash creation.
The marketing BCG matrix is beneficial in providing a company vision to improve its market share and simultaneously reduce costs.
References
Smart Insight – How to use the Matrix Model. Available at: https://www.smartinsights.com/marketing-planning/marketing-models/use-bcg-matrix/