Business owners understand that for the company to grow and succeed, they should go beyond the mentality of “business as usual.” This means they need to explore new ways to generate more sales and reach more customers. There are various ways that businesses can utilize, including developing more recent products or entering on relevant existing projects.
This article will tackle the Ansoff matrix, its uses, and simple ways to create it.
What is the Ansoff Matrix?
H. Igor Ansoff actually developed the Ansoff matrix which was published in the Harvard Business Review in 1957. The article “Strategies for Diversification” gave generations of business leaders and marketers a straightforward solution to think about and explore the risk of growth.
Some experts and marketers call it the Corporate Ansoff Matrix or the Product/Market Expansion Grid. Looking at Ansoff matrix examples, you can see four quadrants representing every stage for companies to use. Additionally, it helps them analyze the associated risks with each element.
The Representations of every Ansoff Quadrant
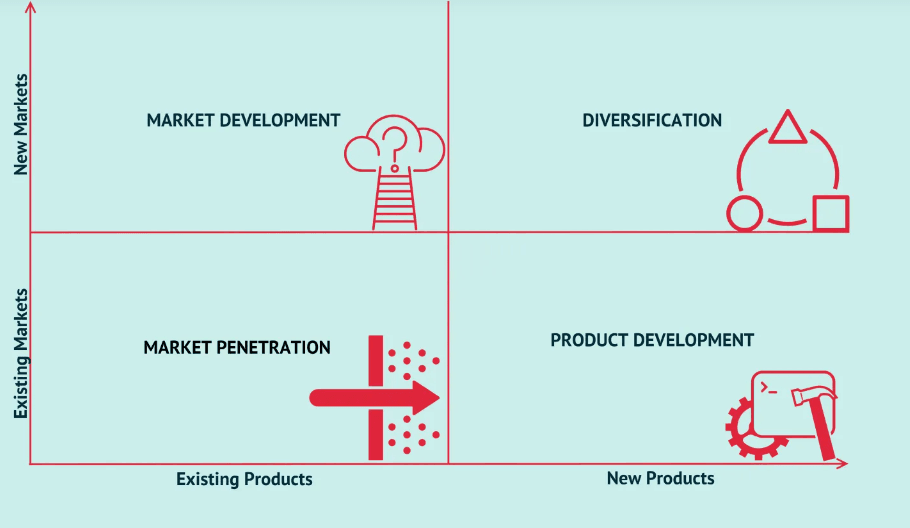
There are four quadrants in this matrix. Each of them needs to be filled out accordingly. How do these quadrants relate to each other? Find out below.
- Market penetration. This section lies in the lower left quadrant, which is considered the safest out of the four. Companies here can focus on expanding their sales of the existing products within the existing market.
- Product development. Besides the market, the penetration quadrant is product development. Experts consider this section riskier since the company is introducing the new products into the market.
- Market development. Here lies the existing product that companies decide to introduce into a new market. You can find this section in the upper left of the matrix. It is also noteworthy to provide new features or benefits to the existing products catering to the new market.
- Diversification. Out of the four quadrants, products or services here are the riskiest. As you look at the upper right quadrant, these are products that are new, unproven, and about to be introduced in a new market without having the assurance that they will generate good results for your company.
Best 10 Ansoff Matrix Examples for Students
If you’re looking for inspiration on how to create this matrix, the following Ansoff matrix examples will be your guide. The examples came from companies that have been in the business for an extended period and utilizing the matrix to introduce new products and generate more sales.
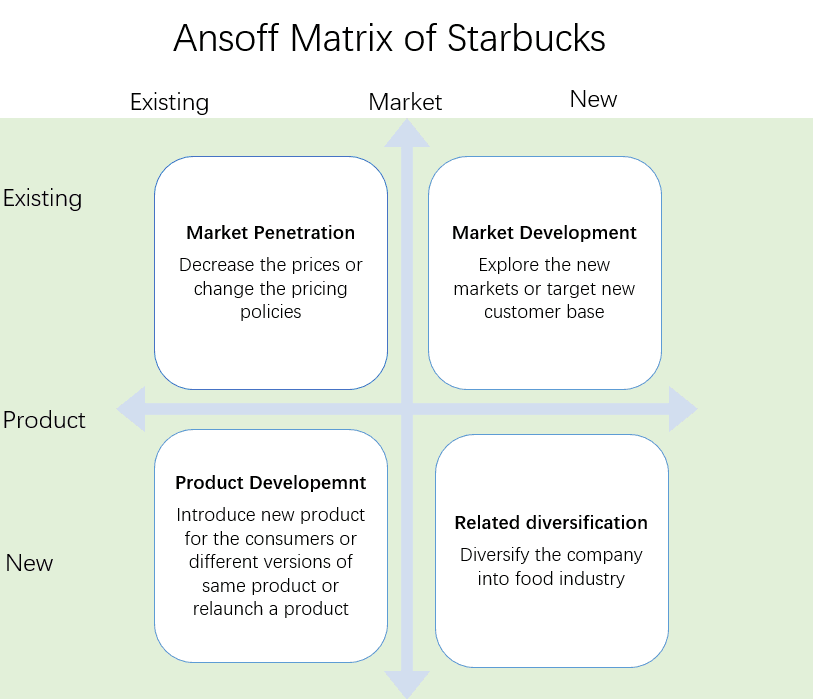
Starbucks Ansoff Matrix
The company continues to thrive with the usual coffee like espresso, cappuccino, etc. At the same time expanding the sales in this department by providing rewards and discounts for loyal customers. Since these Starbucks products are the existing ones that have solidified their positions to be significant generators of money, the company enhanced its services around them. Under the market development quadrant, you can see the introduction of additional coffee blended products and Frappuccino, which coffee lovers warmly welcome. Looking at the diversification quadrant, it might seem that the ones Starbucks introduced to the new market paid off as mugs, tumblers, and other things related to coffee are slowly becoming a hit.
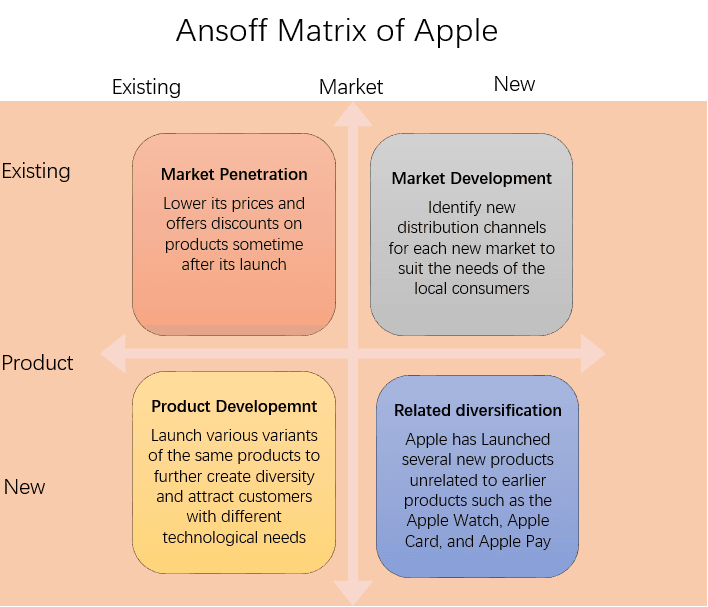
Apple Ansoff Matrix
Ansoff matrix examples come in various formats and styles. This example below is of Apple’s and the illustration uses photos and text to present a more compelling analysis. Looking at the matrix, it is evident that Apple has firmly positioned its gadgets in the industry, making them one of the leading providers of mobile phones. They continue to penetrate the stock market using iPhones, laptops, and desktops, thus resulting in better sales generation. In terms of the company’s efforts to introduce new products to new markets, they still have yet to get the optimum potential of iWatches, Apple TV, and iTunes to excel among their competitors in this niche.
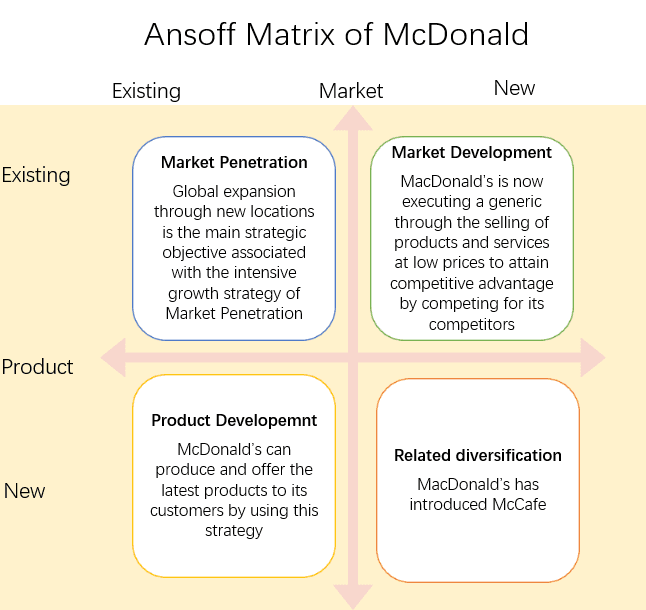
McDonald’s Ansoff Matrix
McDonald’s continues to effectively expand its current products with various chicken meals, breakfast items, and happy meals for kids, and more drive-throughs. At the same time, looking at the matrix below, the company introduced its existing products to various global markets under the market development quadrant. This is why you can buy and taste McDonald’s wherever you may be.
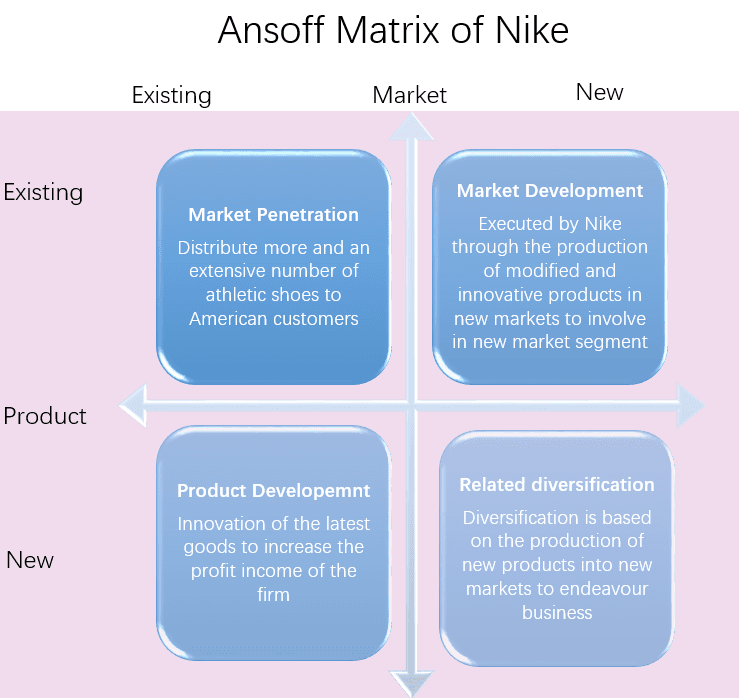
Nike Ansoff Matrix
Nike’s products keep on evolving. This is all thanks to how the company continues to develop products incorporating and integrating the latest technologies. One concrete example of this is the lightweight shoes that promote better mobility when used during outdoor physical activities. Also, Nike’s introduction of apparel and other sports goods to the market has yet to be evaluated whether it generated considerable sales and market reach, similar to athletic shoes. This analysis is evident in how most physical stores look. Most corners of their stores contain shoes, proving how these products have more customers than Nike’s other products.
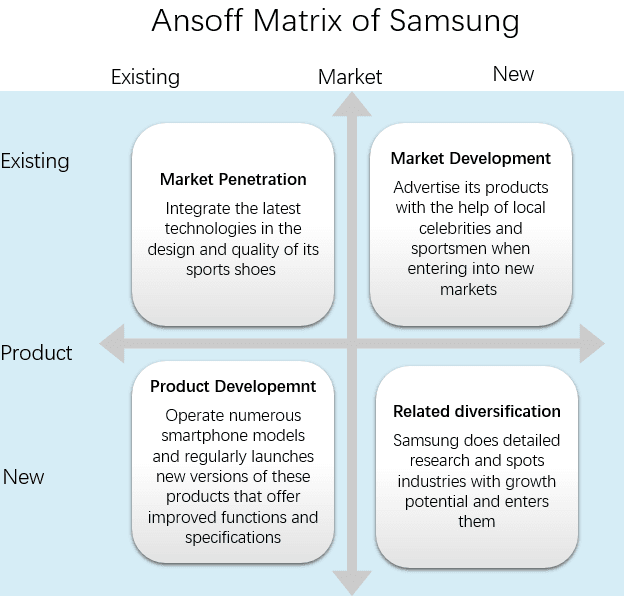
Samsung Ansoff Matrix
Samsung usually adopts aggressive marketing initiatives and competitive pricing to increase its current market share. You might notice this when the company lowers the prices of the existing mobile phones once they launch a new one. Samsung also is one of the leading providers of mobile phones and other gadgets. However, you can see from the matrix below that the company also expanded its products to new markets. This includes home appliances, medical equipment, apparel, and automotive, to name a few. Initially, the company diversified into various businesses and products after seeing an opportunity for growth potential in multiple regions across the globe.
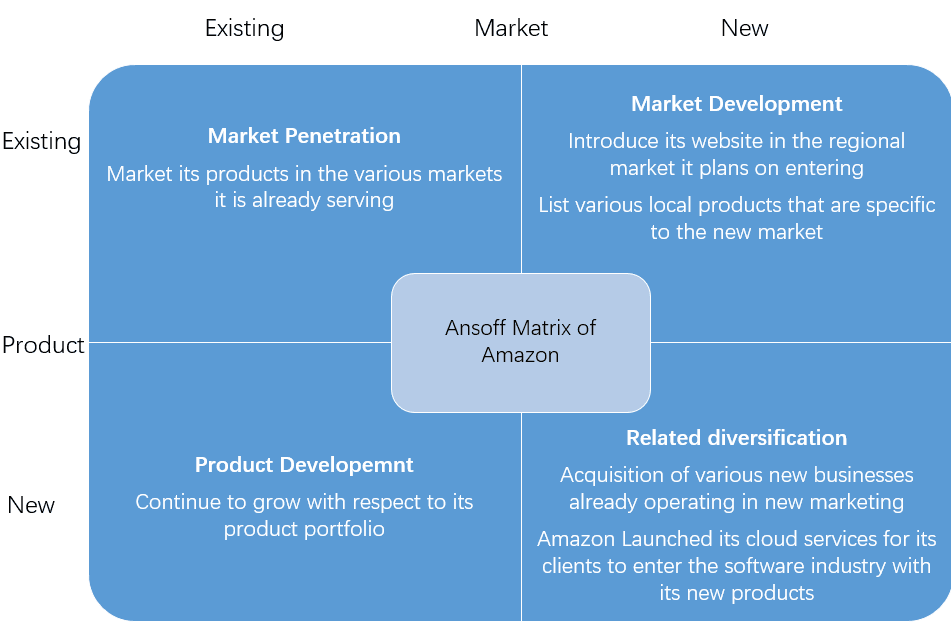
Amazon Ansoff Matrix
Amazon leads when it comes to providing thousands of varieties of products that you can purchase online. It started as an online store selling books. However, the company expanded to introduce more products to its market, including furniture, electronics, smartphones, clothes, and many more. When it comes to Amazon’s market development, it did not just expand to new markets and introduce its services. It opened an Amazon website in Hindi to accommodate customers in India who are not fluent in English. More than the products, they continue to expand services to their existing market because of the website’s user-friendly interface.
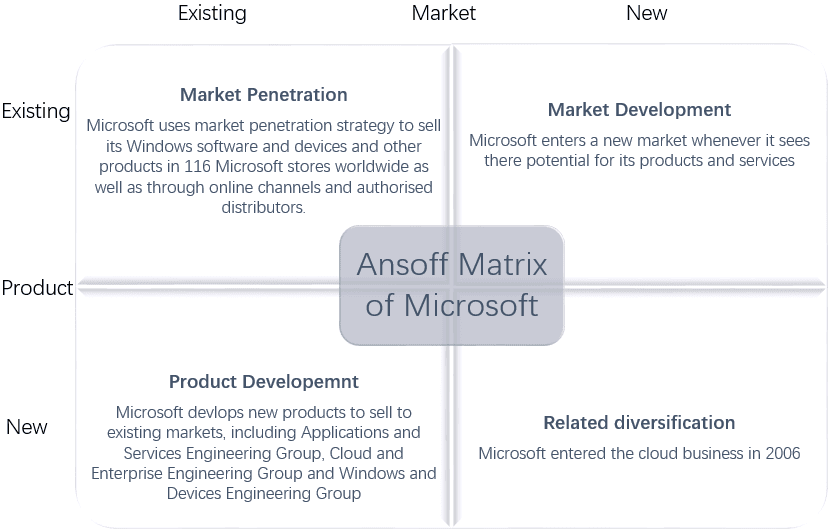
Microsoft Ansoff Matrix
An interesting thing about Microsoft’s Ansoff Matrix is how they significantly emphasize product development. Looking at the diagram below, three teams are handling different aspects in every development of their services. Groups of people focus on comprehensive services and applications in communication, productivity, search, and education. Other groups are assigned to monitor and develop cloud infrastructure, database, server, and CRM, to name a few. With all these developments, the company can expand to countries worldwide.
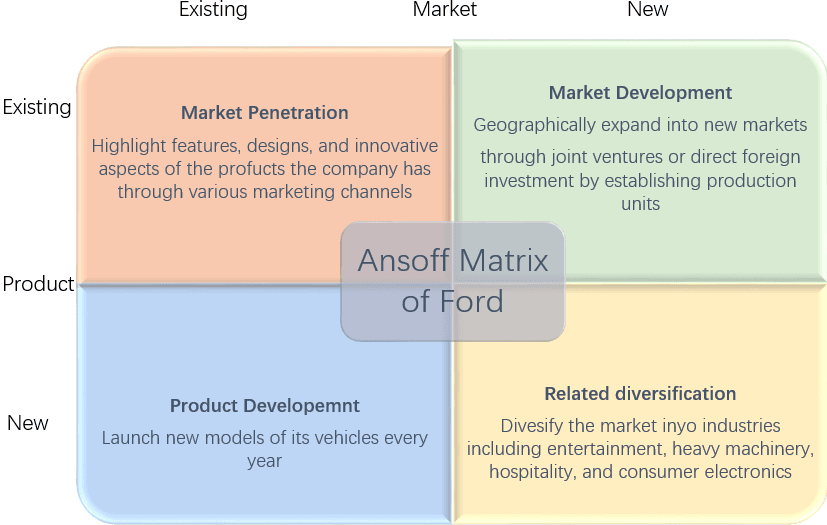
Ford Ansoff Matrix
The automotive industry sure is competitive. However, Ford continues to thrive among its competitors. Thanks to its marketing initiatives which significantly lie on print media, social media, and television. As the brand grew, the company diversified its market into various industries, including entertainment, heavy machinery, hospitality, and consumer electronics.
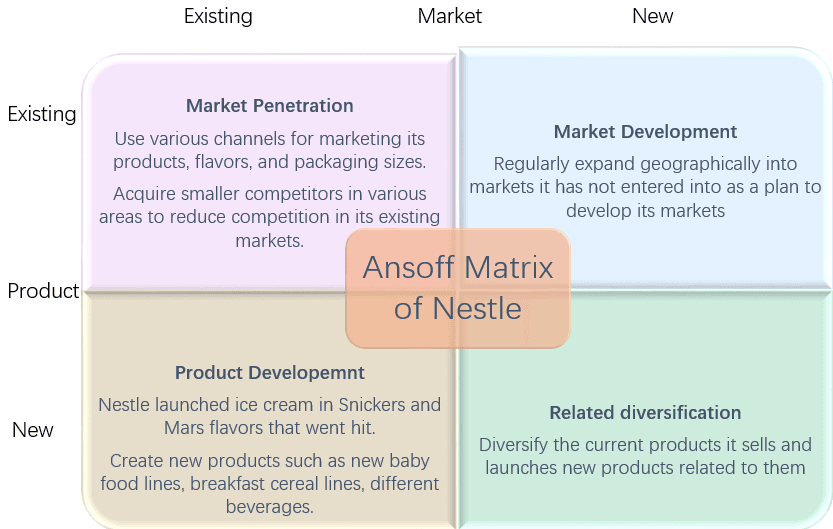
Nestle Ansoff Matrix
There are instances when you cannot fill all the quadrants in a matrix. The same goes for this one below. Nestle initially maintained its position in its target markets by providing all its products with different sizes and packaging styles. That is why you can see Nestle products’ plastic, box, and paper packaging. What’s more interesting about this company is that as they continue to expand their market to different countries, they modify products that suit the local market. This is also why some products are available in India, but in the Philippines, for example.
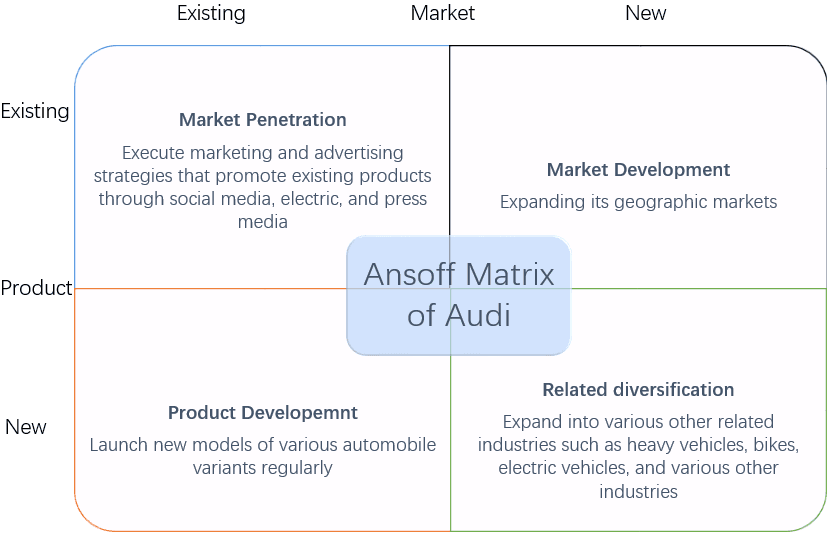
Audi Ansoff Matrix
While Audi continues to be one of the leading luxury car brands, it is interesting that the company also diversified its market. Indeed, you can expect them to keep innovating styles on their luxury cars to accommodate their existing market. For Audi, they are also trying to introduce electric vehicles and bikes. The markets are new, but the company aims to get more responses, similar to the ones they get from their existing markets.
Final Thoughts
As you study companies, it can be a handful to segment the products, especially if it involves various kinds and variants. You can refer to the Ansoff matrix examples as you create your diagram. The diagram itself is very straightforward. While online tools and software will provide you with various customization options, ensure you do not overdo it. It might lose the diagram’s purpose, which is to provide specific and concrete information on a company’s growth. Like what was done above, you can mix texts and photos for the diagram.