Understanding cause-and-effect relationships is crucial in making sense of the world around us. It helps us to identify why things happen, how they happen, and what the consequences are. Cause-and-effect graphic organizers are powerful tools that can help us simplify complex relationships, improve critical thinking skills, and enhance problem-solving abilities. In this article, we will discuss what cause-and-effect graphic organizers are, their benefits, how to use them, and answer some frequently asked questions.
What is a Cause-and-Effect Graphic Organizer?
A cause-and-effect graphic organizer is a visual tool that helps to organize and analyze the relationships between events or actions and their consequences. It allows us to see how different factors interact with each other and how they contribute to a particular outcome.
A cause-and-effect graphic organizer is a visual representation of the relationships between events or actions and their consequences. It is a tool used to organize and analyze complex information and identify patterns and connections.
Cause-and-effect graphic organizers work by breaking down complex information into smaller, more manageable parts. By identifying the cause-and-effect relationships between events or actions, we can better understand how they are connected and how they contribute to a particular outcome.
Cause-and-effect relationships can be found in many aspects of our lives. For example, if we don't get enough sleep, we may feel tired and irritable the next day. If we eat unhealthy foods, we may gain weight and develop health problems. If we don't study for a test, we may fail.
Benefits of Cause-and-Effect Graphic Organizers
Cause-and-effect graphic organizers offer numerous benefits for students, teachers, and professionals in various fields. Here are some of the most significant advantages of using cause-and-effect graphic organizers:
Improved Critical Thinking Skills
Cause-and-effect graphic organizers help students develop critical thinking skills by encouraging them to analyze relationships between events and actions. By identifying the causes and effects of a particular event, students can learn to think logically and make informed decisions.
Enhanced Problem-Solving Abilities
Cause-and-effect graphic organizers can help students and professionals identify the root cause of a problem and develop effective solutions. By breaking down complex issues into smaller parts and analyzing the relationships between them, users can identify patterns and connections that might otherwise go unnoticed.
Better Understanding of Complex Relationships
Cause-and-effect graphic organizers can help users better understand complex relationships between events and actions. By visually representing these relationships, users can identify patterns and connections that might be difficult to see otherwise.
Increased Organization and Clarity of Thoughts
Cause-and-effect graphic organizers provide a visual representation of information that can help users organize and clarify their thoughts. By breaking down complex issues into smaller parts, users can identify the most significant causes and effects and develop a clearer understanding of the topic.
Efficient Brainstorming and Idea Generation
Cause-and-effect graphic organizers can stimulate brainstorming and idea generation by encouraging users to think creatively about the relationships between events and actions. By identifying multiple causes and effects, users can generate new ideas and develop innovative solutions.
Effective Communication and Presentation of Ideas
Cause-and-effect graphic organizers can help users communicate and present their ideas more effectively. By providing a visual representation of information, users can convey complex ideas in a clear and concise manner, making it easier for others to understand and engage with the material.
How to Use a Cause-and-Effect Graphic Organizer
Cause-and-effect graphic organizers are versatile tools that can be used in various fields, including education, business, and research. Here are the steps to use a cause-and-effect graphic organizer effectively:
Identify the Main Event or Problem
The first step in using a cause-and-effect graphic organizer is to identify the main event or problem that you want to analyze. This event or problem should be clearly defined and specific, as it will serve as the focus of your analysis.
Brainstorm Possible Causes and Effects
Once you have identified the main event or problem, the next step is to brainstorm possible causes and effects. This step involves generating a list of all the possible factors that might have contributed to the event or problem and all the potential consequences that might result from it.
Organize and Categorize Causes and Effects
After brainstorming possible causes and effects, the next step is to organize and categorize them. This step involves grouping similar causes and effects together and organizing them in a logical and meaningful way. This can be done by using a graphic organizer, such as a fishbone diagram or a flowchart, to visually represent the relationships between the different factors.
Analyze the Relationships Between Causes and Effects
Once you have organized and categorized the causes and effects, the next step is to analyze the relationships between them. This step involves examining the connections between the different factors and determining how they contribute to the main event or problem. By analyzing the relationships between causes and effects, you can identify patterns and connections that might otherwise go unnoticed.
Draw Conclusions and Develop Solutions
The final step in using a cause-and-effect graphic organizer is to draw conclusions and develop solutions. This step involves using the information gathered from the analysis to make informed decisions and develop effective solutions. By identifying the root cause of a problem, you can develop targeted solutions that address the underlying issues and prevent similar problems from occurring in the future.
Tips for Effective Use of Cause-and-Effect Graphic Organizers
Cause-and-effect graphic organizers are powerful tools for analyzing complex issues and developing targeted solutions. Here are some tips for using cause-and-effect graphic organizers effectively:
Be Specific and Clear
When using a cause-and-effect graphic organizer, it is important to be specific and clear about the main event or problem that you are analyzing. This will help you to focus your analysis and ensure that you are addressing the most important issues.
Focus on One Main Event or Problem
It is also important to focus on one main event or problem at a time when using a cause-and-effect graphic organizer. Trying to analyze multiple issues at once can be overwhelming and can lead to confusion and ineffective analysis.
Use Evidence and Examples to Support Ideas
When brainstorming possible causes and effects, it is important to use evidence and examples to support your ideas. This will help to ensure that your analysis is grounded in reality and that your conclusions are valid.
Revise and Refine the Organizer as Needed
As you work through the analysis process, it is important to revise and refine the cause-and-effect graphic organizer as needed. This may involve adding or deleting factors, reorganizing the relationships between causes and effects, or modifying your conclusions based on new information.
Use the Organizer as a Tool for Communication
A cause-and-effect graphic organizer can be a powerful tool for communication, allowing you to present complex information in a clear and concise way. Consider sharing your organizer with others to help them understand the relationships between causes and effects and the solutions that you have developed.
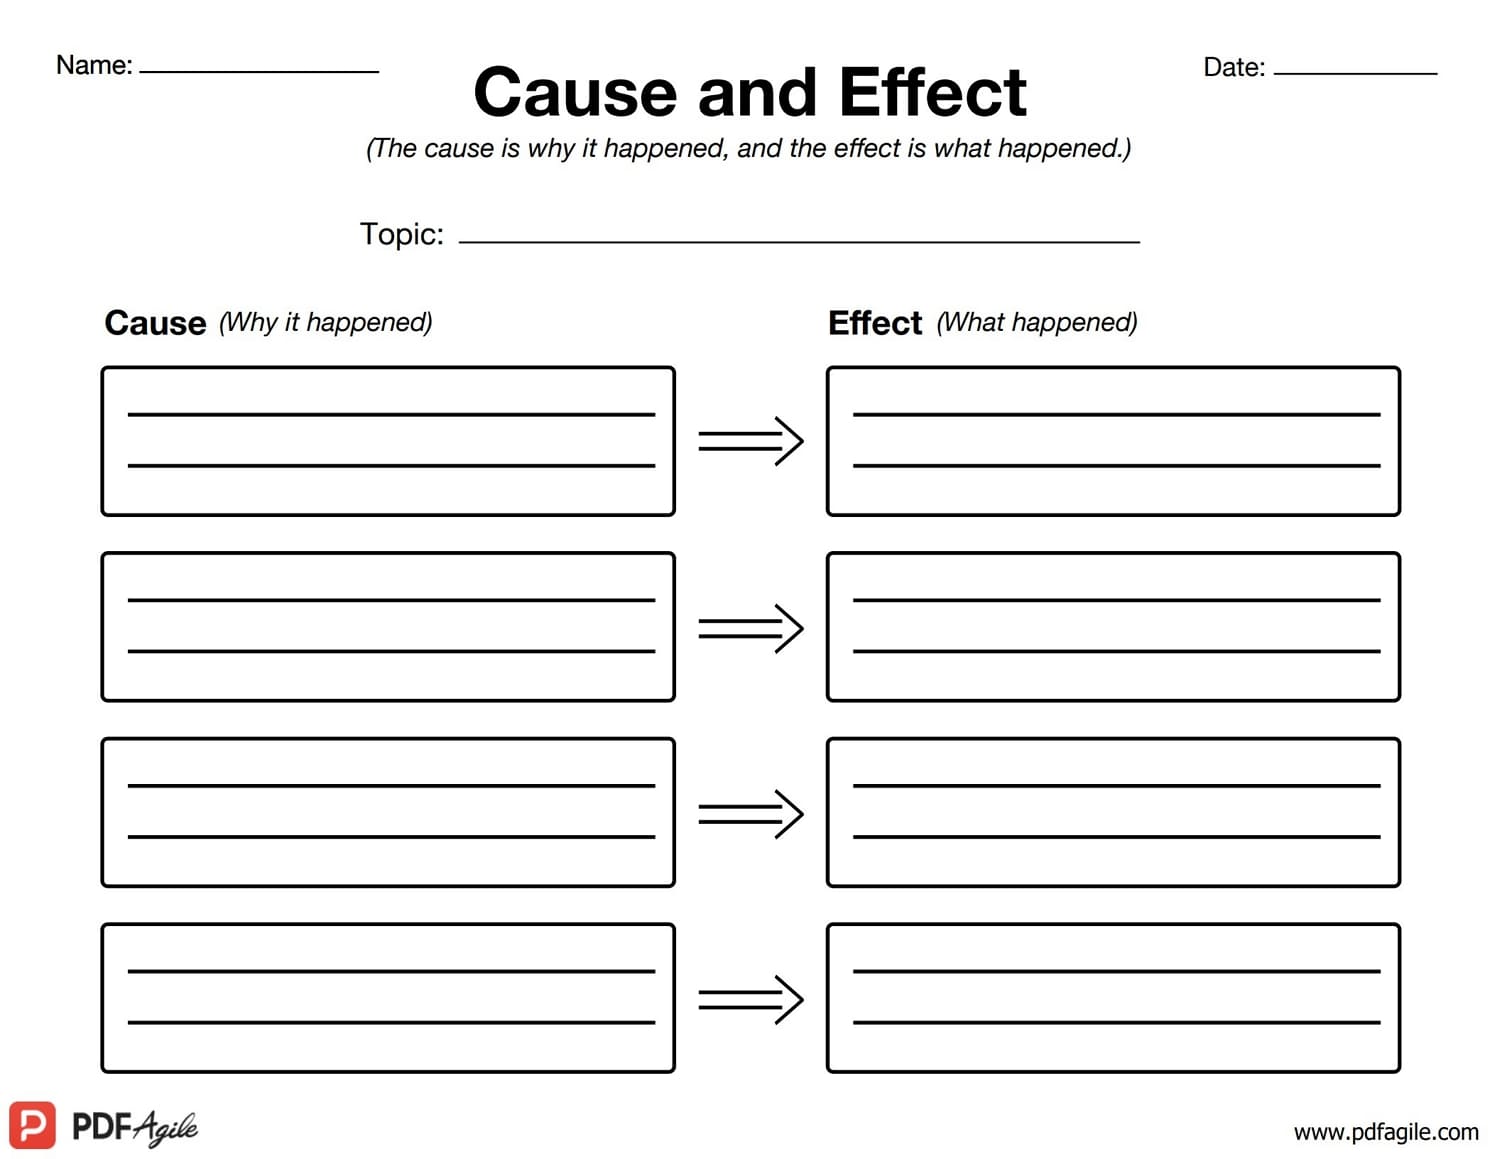
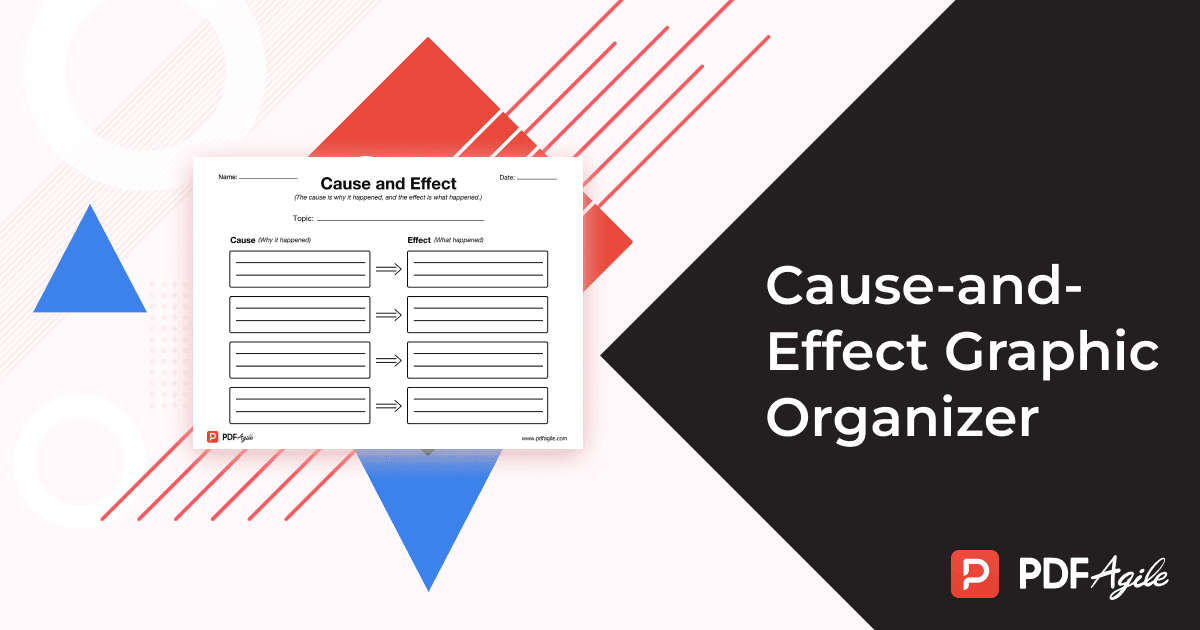
Free Download a Printable Cause-and-Effect Graphic Organizer Template
You can download the cause-and-effect graphic organizer PDF template, edit it, and convert it to other file types using PDF Agile. You can use the built-in template also to create your own cause-and-effect graphic organizer. Find more graphic organizer PDF templates in PDF Agile Templates Center.
FAQs about Cause-and-Effect Graphic Organizer
Here are some frequently asked questions about cause-and-effect graphic organizers:
Q: What is the difference between a cause-and-effect graphic organizer and a timeline?
A: A cause-and-effect graphic organizer shows the relationships between events or actions and their consequences, while a timeline shows the order in which events occur.
Q: Can cause-and-effect graphic organizers be used in any subject area?
A: Yes, cause-and-effect graphic organizers can be used in any subject area where cause-and-effect relationships exist.
Q: How can I create a cause-and-effect graphic organizer?
A: You can create a cause-and-effect graphic organizer using paper and pencil, or by using online tools such as graphic organizer templates or mind mapping software.
Q: How do I know if I have identified all the causes and effects of a particular event?
A: It is unlikely that you will be able to identify all the causes and effects of a particular event, as there may be factors that are unknown or beyond your control. However, by brainstorming and analyzing the relationships between events and actions, you can identify the most significant causes and effects.
Q: Can cause-and-effect graphic organizers be used for group work?
A: Yes, cause-and-effect graphic organizers can be used for group work, as they provide a visual representation of information that can be shared and discussed by the group.