TAG: Excel Tips
How-to & Tips4 Mins
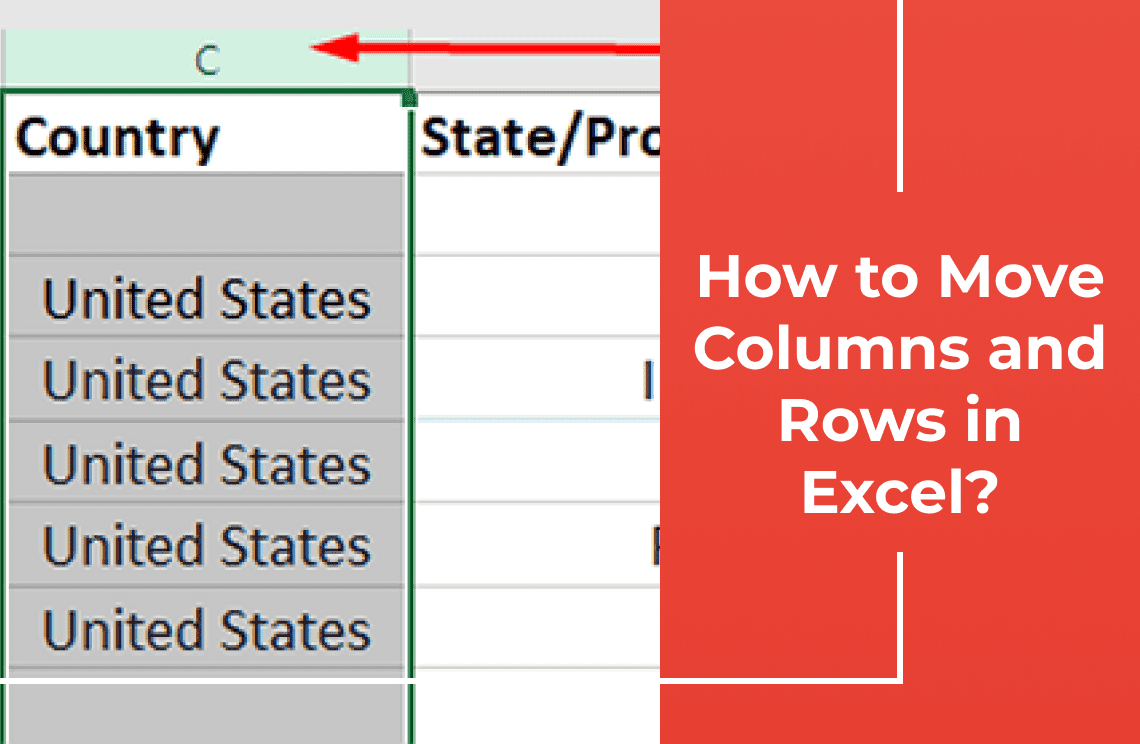
How to Move Columns and Rows in Excel?
Learn 3 easy methods to move columns and rows in Excel: drag & drop, Shift key, and cut/insert. Organize data efficiently and maintain integrity.
Read More >>
How-to & Tips4 Mins
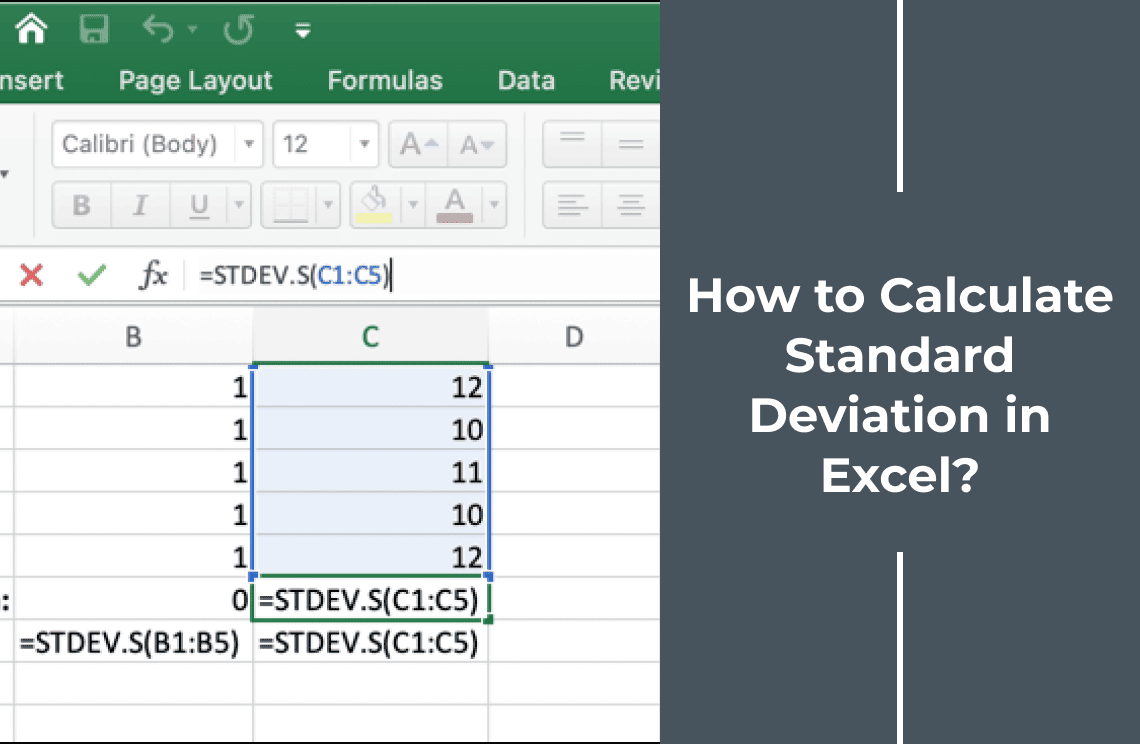
How to Calculate Standard Deviation in Excel?
Calculate standard deviation in Excel easily! Learn STDEV.S & STDEV.P, interpret results, and add error bars to charts. Understand data variability now.
Read More >>

How-to & Tips5 Mins
How to Use VLOOKUP in Excel Effortlessly?
Master Excel's VLOOKUP! Learn to retrieve data efficiently across sheets and workbooks. This guide covers syntax, troubleshooting, and practical examples.
Read More >>
How-to & Tips5 Mins
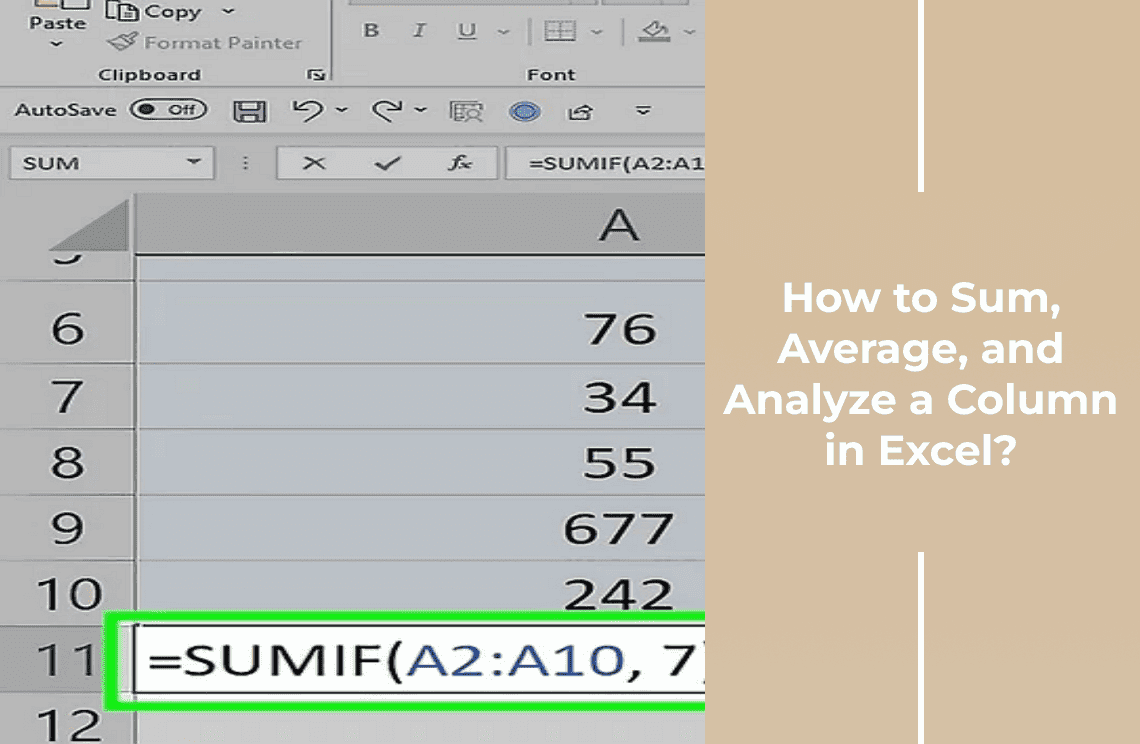
How to Sum, Average, and Analyze a Column in Excel: A Complete Guide
Master Excel data! Learn to sum, average, and analyze columns efficiently. This guide covers AutoSum, AVERAGEIF, charts, shortcuts, and data integrity tips.
Read More >>
How-to & Tips12 Mins
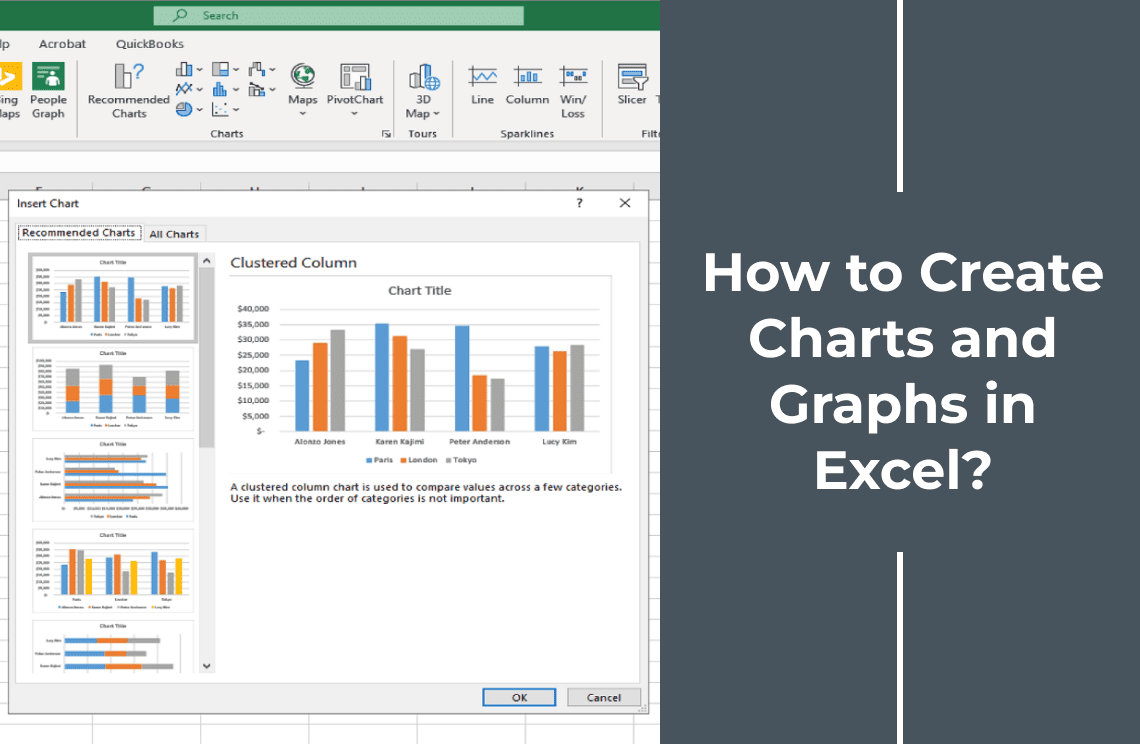
How to Create Charts and Graphs in Excel?
Learn to create dynamic Excel charts with data tables, interactive slicers, and combination charts. Enhance data visualization and user interaction.
Read More >>
How-to & Tips4 Mins
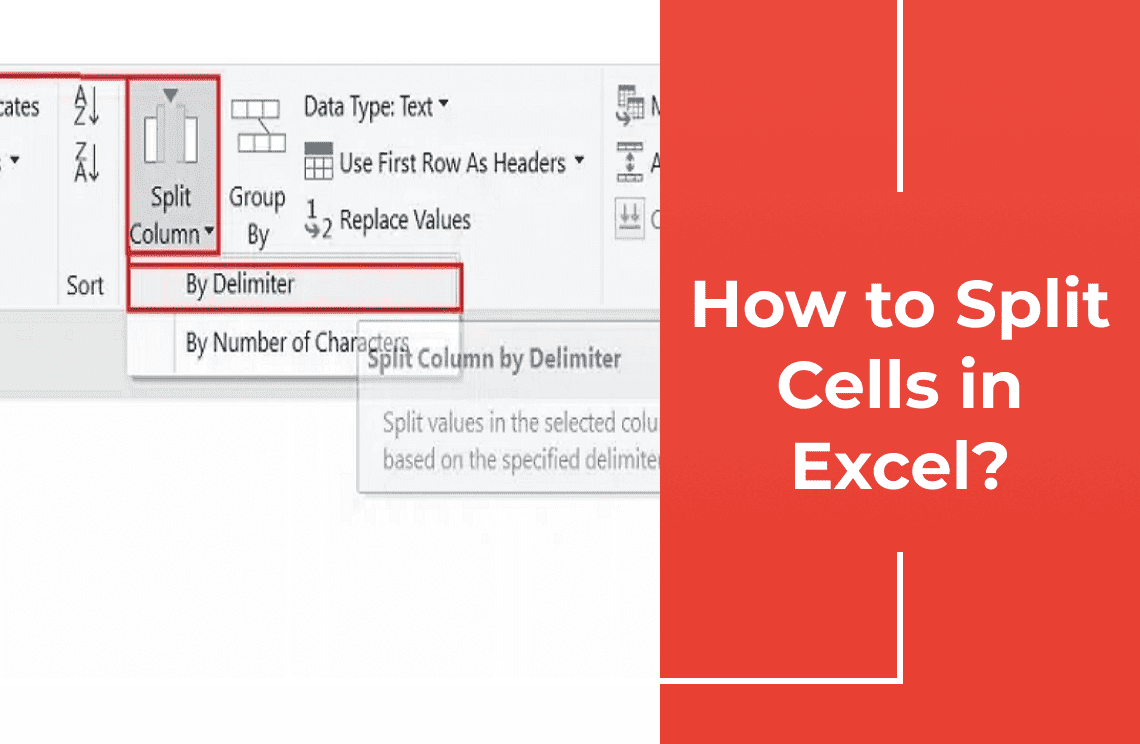
How to Split Cells in Excel Quickly?
Learn to split cells in Excel using Text to Columns, Flash Fill, formulas, and Power Query. Simplify data management & boost productivity with these tips.
Read More >>

How-to & Tips6 Mins
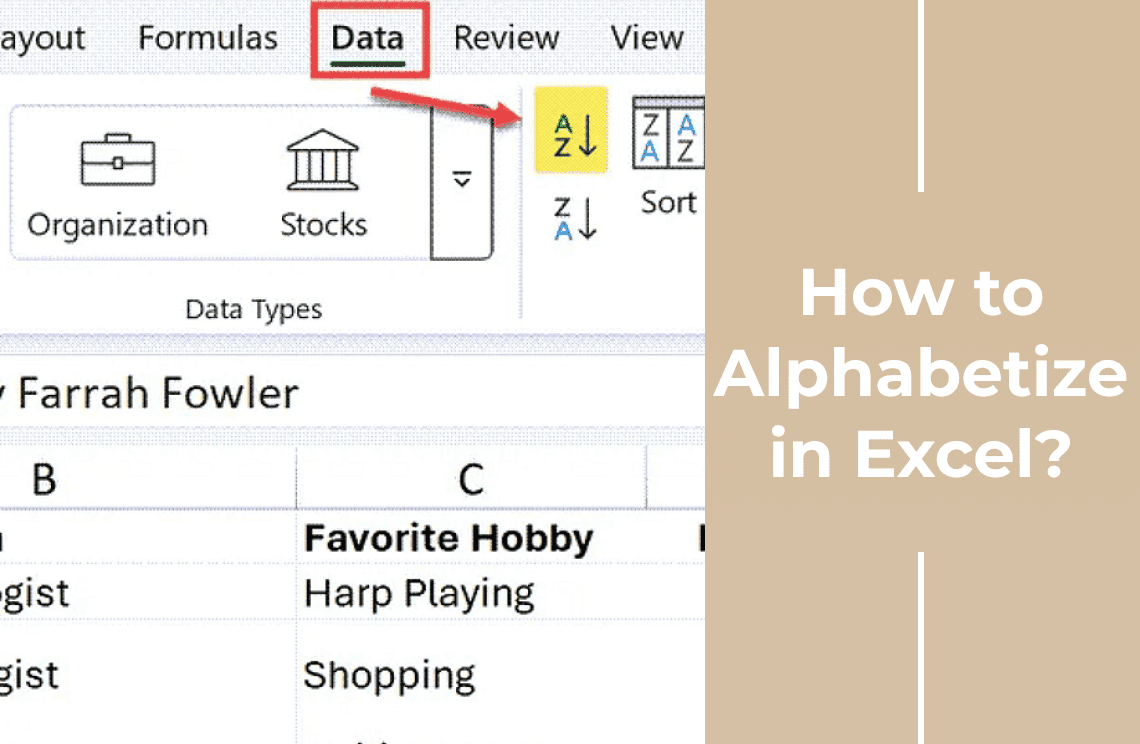
How to Sort in Excel: Basic Tips for Faster & Smarter Data Management?
Master Excel sorting! Learn basic, multi-column, custom, and filtered sorts to organize data efficiently. Boost productivity and gain insights quickly.
Read More >>
How-to & Tips3 Mins
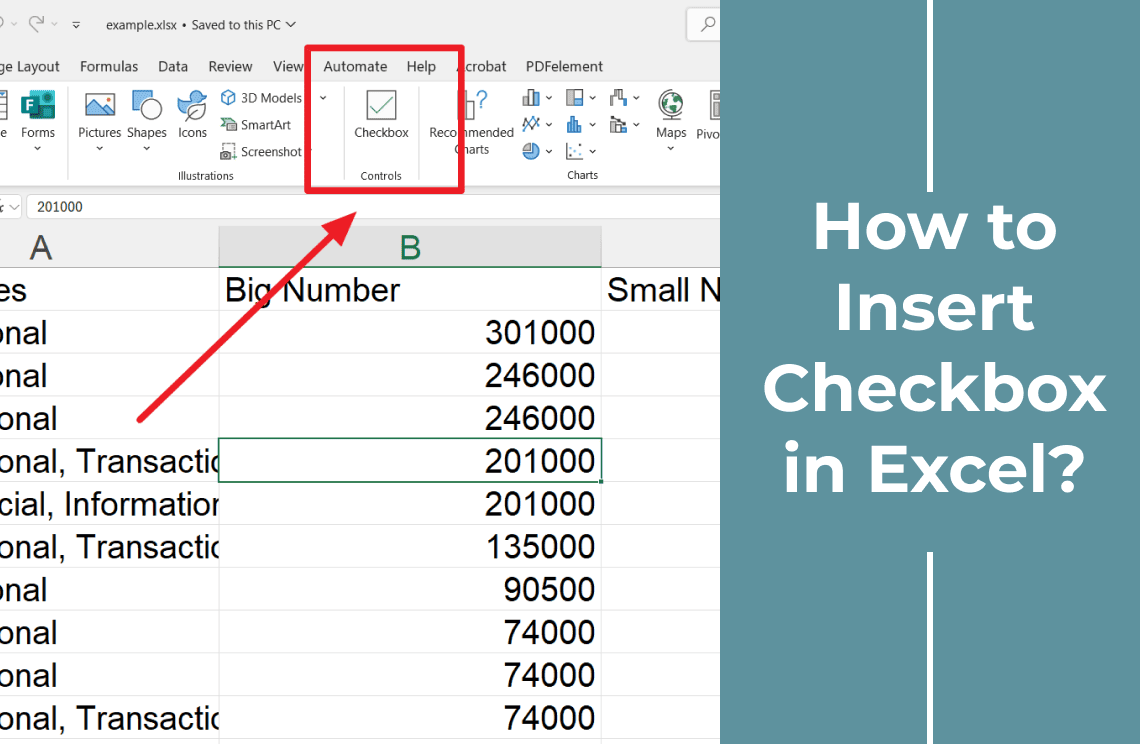
How to Insert Checkbox in Excel with Ease?
Discover the new, user friendly Excel checkbox feature! Learn how to easily insert, format, and delete checkboxes for effective task tracking. Create interactive lists, visualize progress with summaries, and streamline your workflow. Perfect for project management, checklists, and more.
Read More >>